


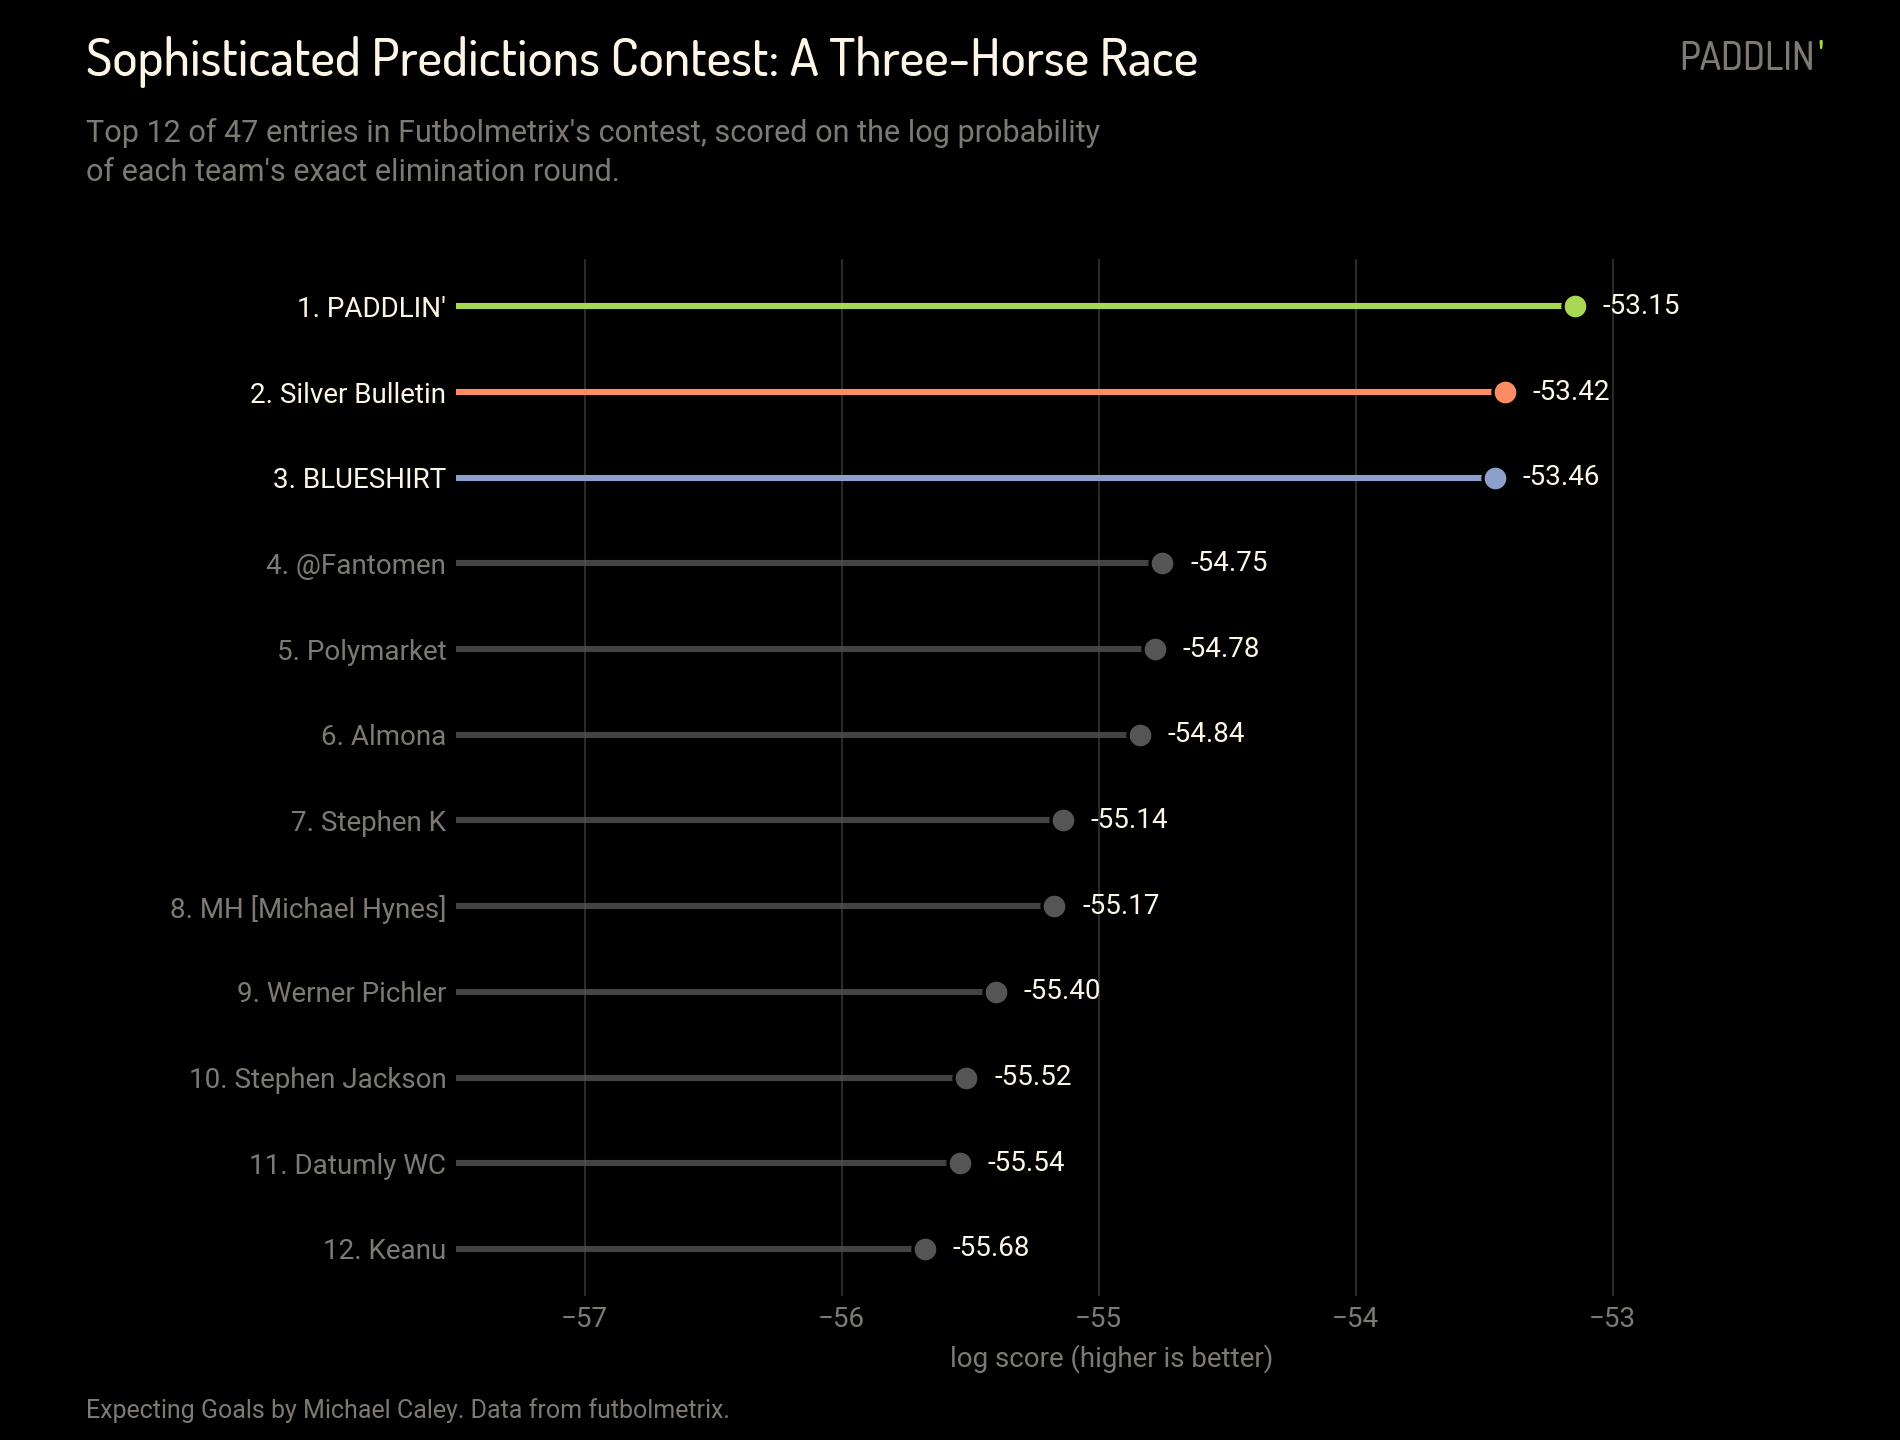
During every major international tournament, the blogger Futbolmetrix runs a “Sophisticated Prediction Contest”, inviting analysts to share their prediction models and see who performs the best with a statistically proper scoring rule.1 This year there were 47 entries including PADDLIN’, and of these 33 were distinct models, depending on your definition.2
PADDLIN’ won the contest.
Don’t miss the Expecting Goals three-part extravaganza on Lionel Messi, Cristiano Ronaldo, and the analytics of the GOAT debate:
Part One: The Analytics of Comparing Messi and Ronaldo
Part Two: Messi, Ronaldo, and the Modern Greats: Goals and Assists
Part Three: Messi, Ronaldo and the Modern Greats: Ball Progression
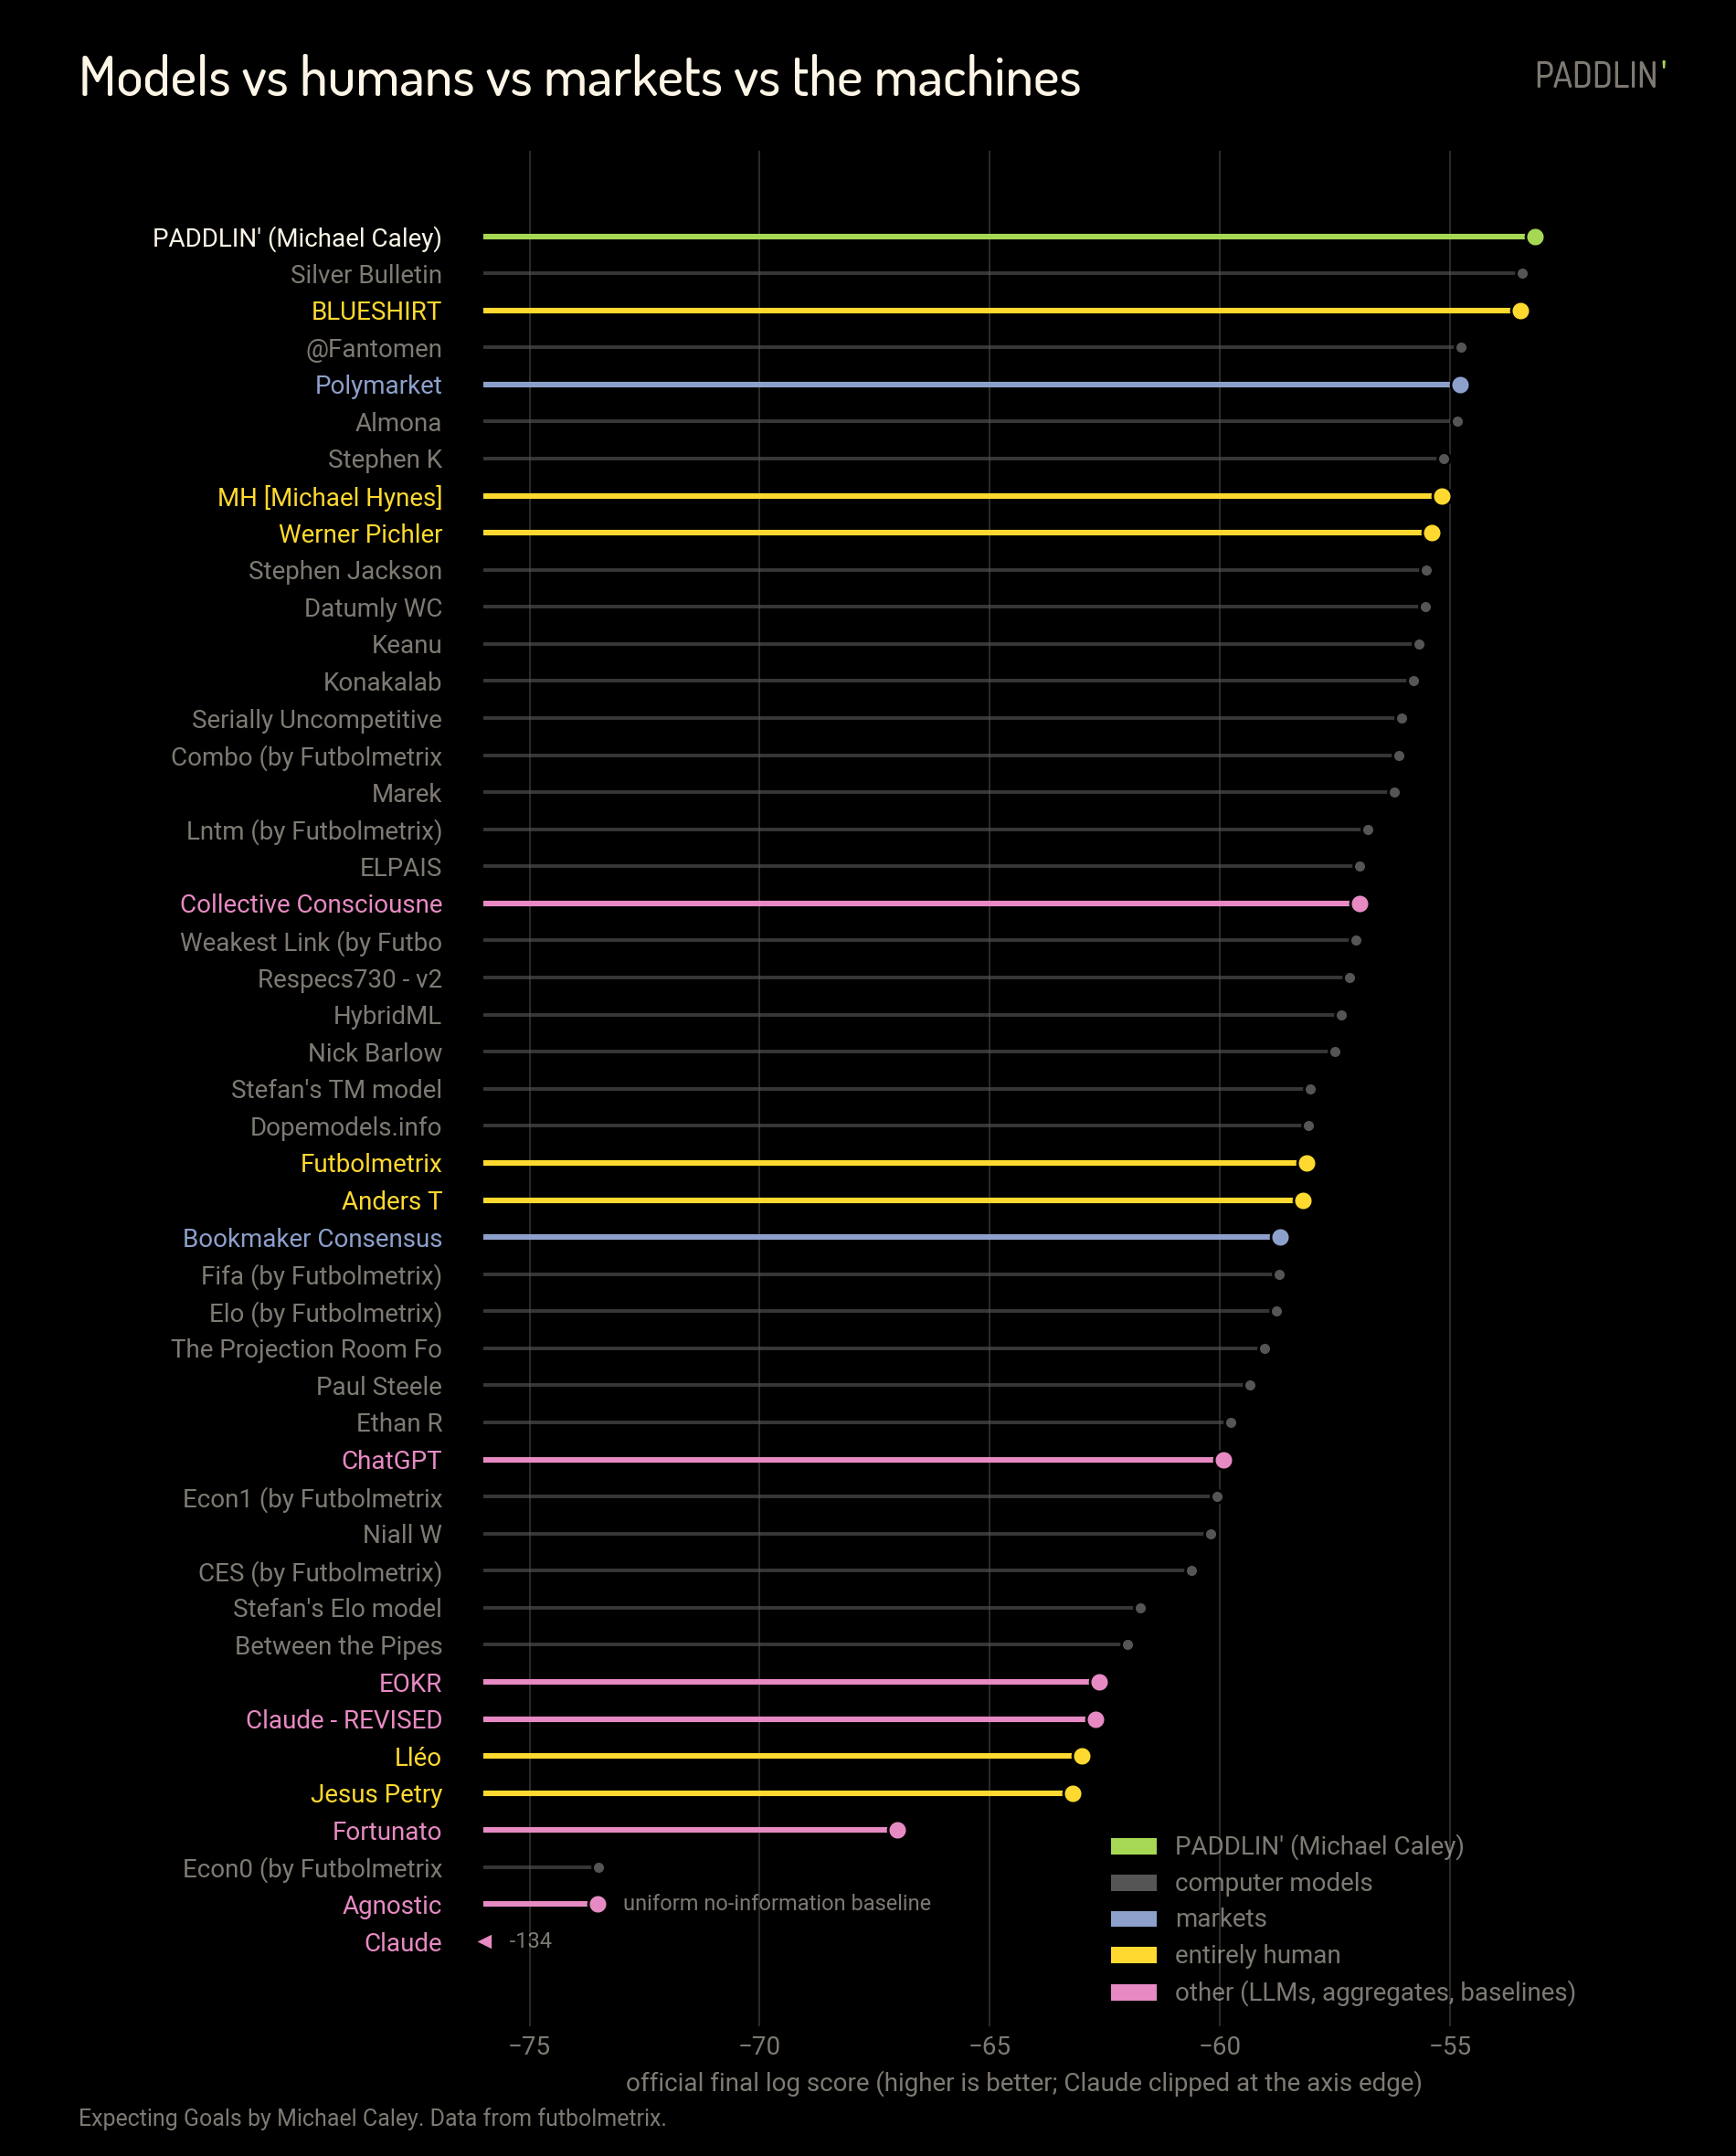
Notably, PADDLIN’ and Nate Silver’s PELE model managed to defend the honor of the modelers as the “BLUESHIRT” predictions were made by a person plugging in their own opinions.3 Along with a few “human” picks, the contest also included a number of baseline models, made using LLMs or various simple aggregates.
The various baselines, whether a pure agnostic model or a Claude or ChatGPT prompt, underperformed the models and the humans. Individual people making subjective picks had a great deal of variance, ending up with three of the top ten overall, and also with two scores lower than any football-based model.4 The Polymarket futures made the top five, but fell slightly behind the Fantomen model as well as the top three.
It is fun and validating to win a contest, and I could just end the newsletter here, but I think there are some lessons to consider about modeling and about what “winning” a contest means.
For one thing, I wrote an entire World Cup semifinals preview in which I talked about why my subjective analysis disagreed with my model. So I cannot take too much credit here. In this newsletter, I’m going to look at how PADDLIN’ won, and consider to what degree I can learn from my disagreement with my model.
I wrote up my model and methodology in the Introducing PADDLIN’ newsletter here, and added continued discussion of its workings across several of the World Cup blogs. Admirably, Nate Silver has continued to publish full explainers of his models, and you can read his exhaustive write-up on PELE here.
The Winning Models Took Similar Risks
The most notable characteristic of the winning models in this contest is that they made precise and confident calls. PADDLIN’ stands out in particular in the group stage, with unusually confident predictions of a group stage exit for some of the worst teams at this World Cup: Curaçao, Qatar, Jordan, Iraq, Haiti, New Zealand, and South Africa. The PELE model also stands out for its aggressive calls on the top four teams at the World Cup: Spain, Argentina, France and England. And both particularly took clear positions on the gaps between better and worse teams likely to meet in the round of 32.
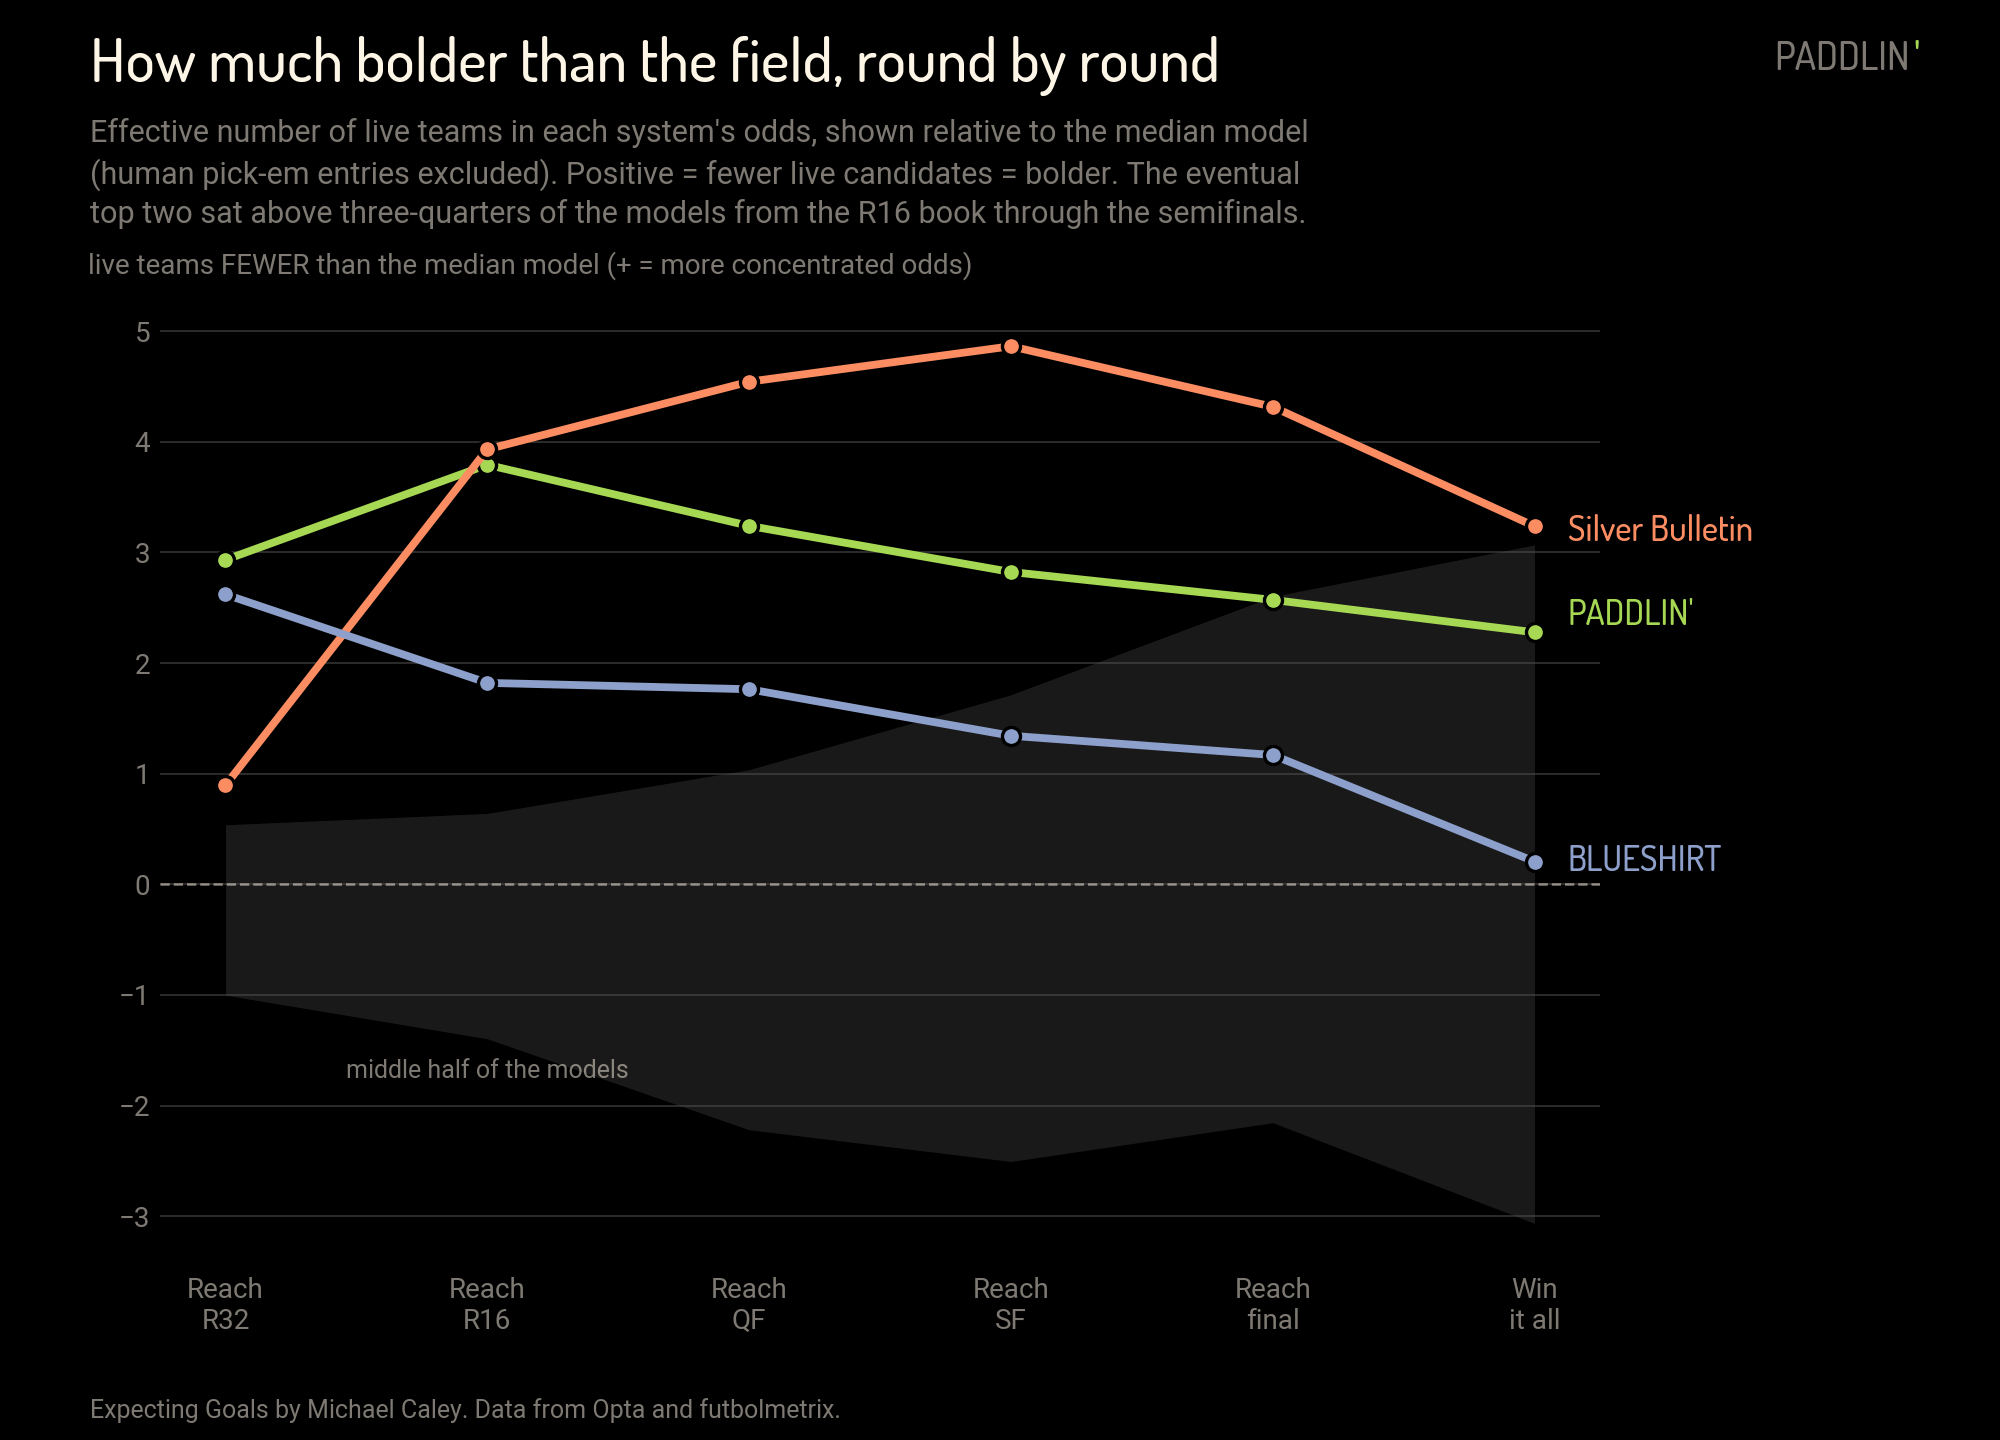
Now, not all of these risky calls paid off. In particular, PADDLIN’ and PELE missed on some of their more off-consensus calls in the group stage and had to catch up.
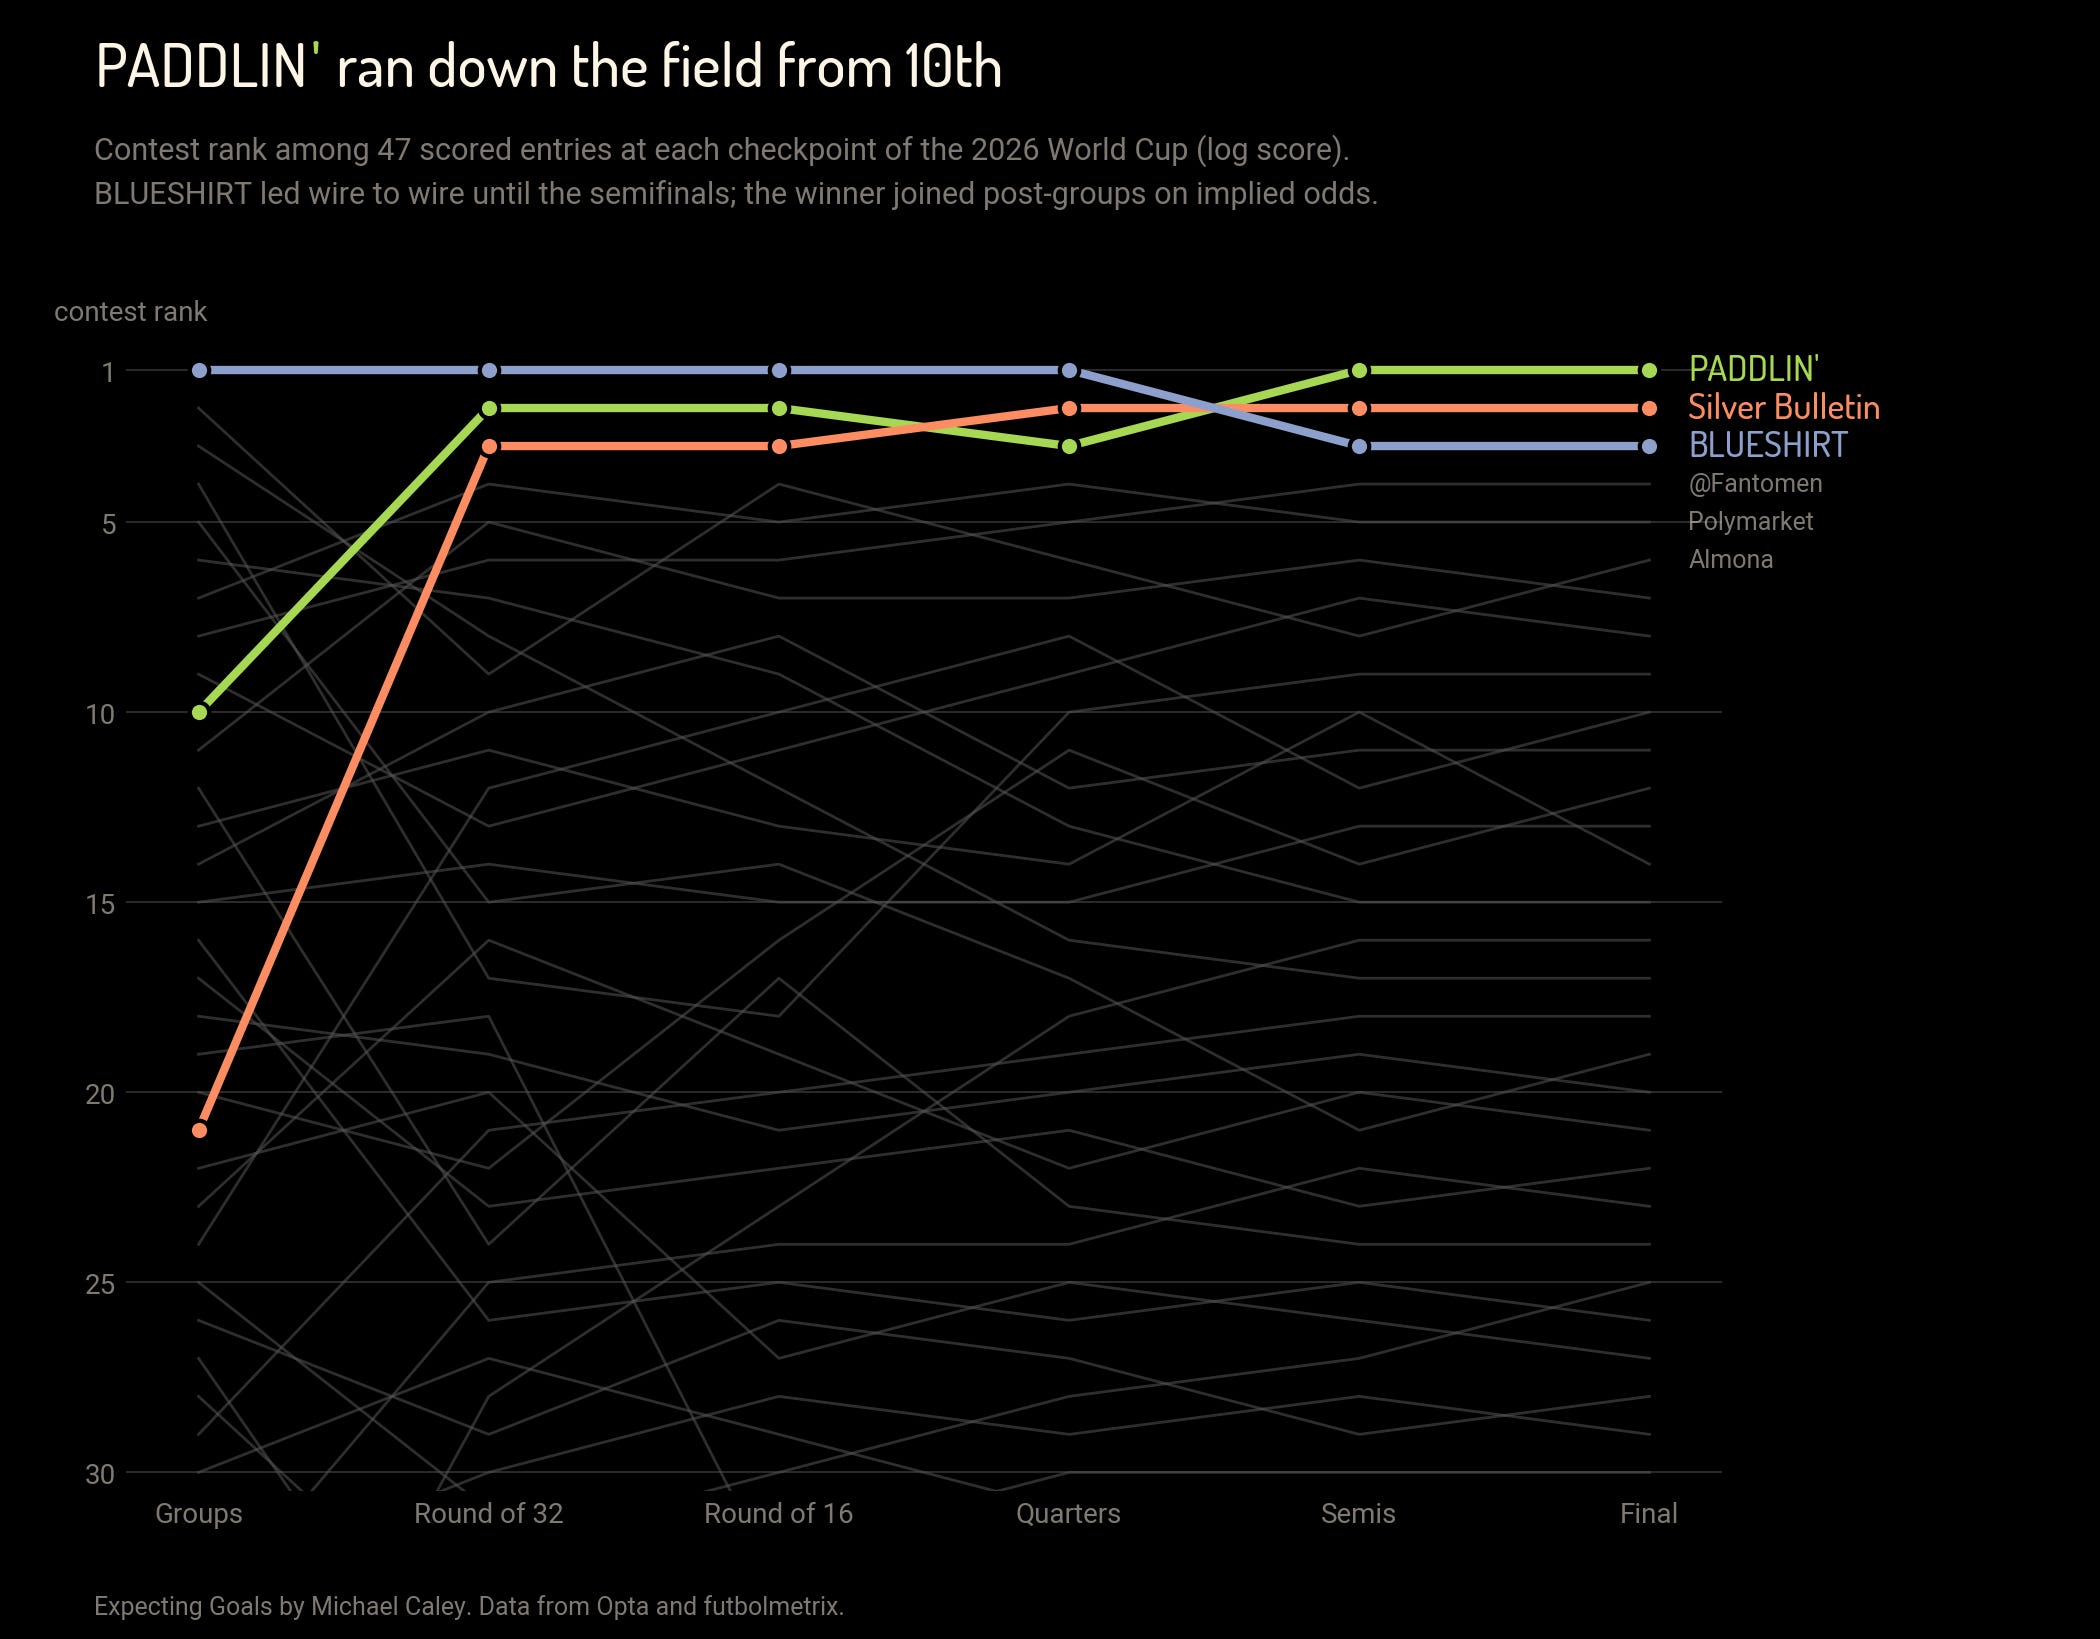
This is probably the most interesting thing about the prediction contest results, to me. Top contenders may succeed in different ways, and indeed BLUESHIRT made the most of group stage qualifying calls and was pegged back during the knockouts. But PADDLIN’ and PELE just had very similar outputs.
At base, it is not terribly surprising that PELE and PADDLIN’ had similar team ratings. Both models were based on a mix of a weighted Elo for team performance and adjusted Transfermarkt value for player quality. The processes of weighting Elo and of adjusting and integrating Transfermarkt value were different, but the shared tendencies are easily identified.
First during the group stage:
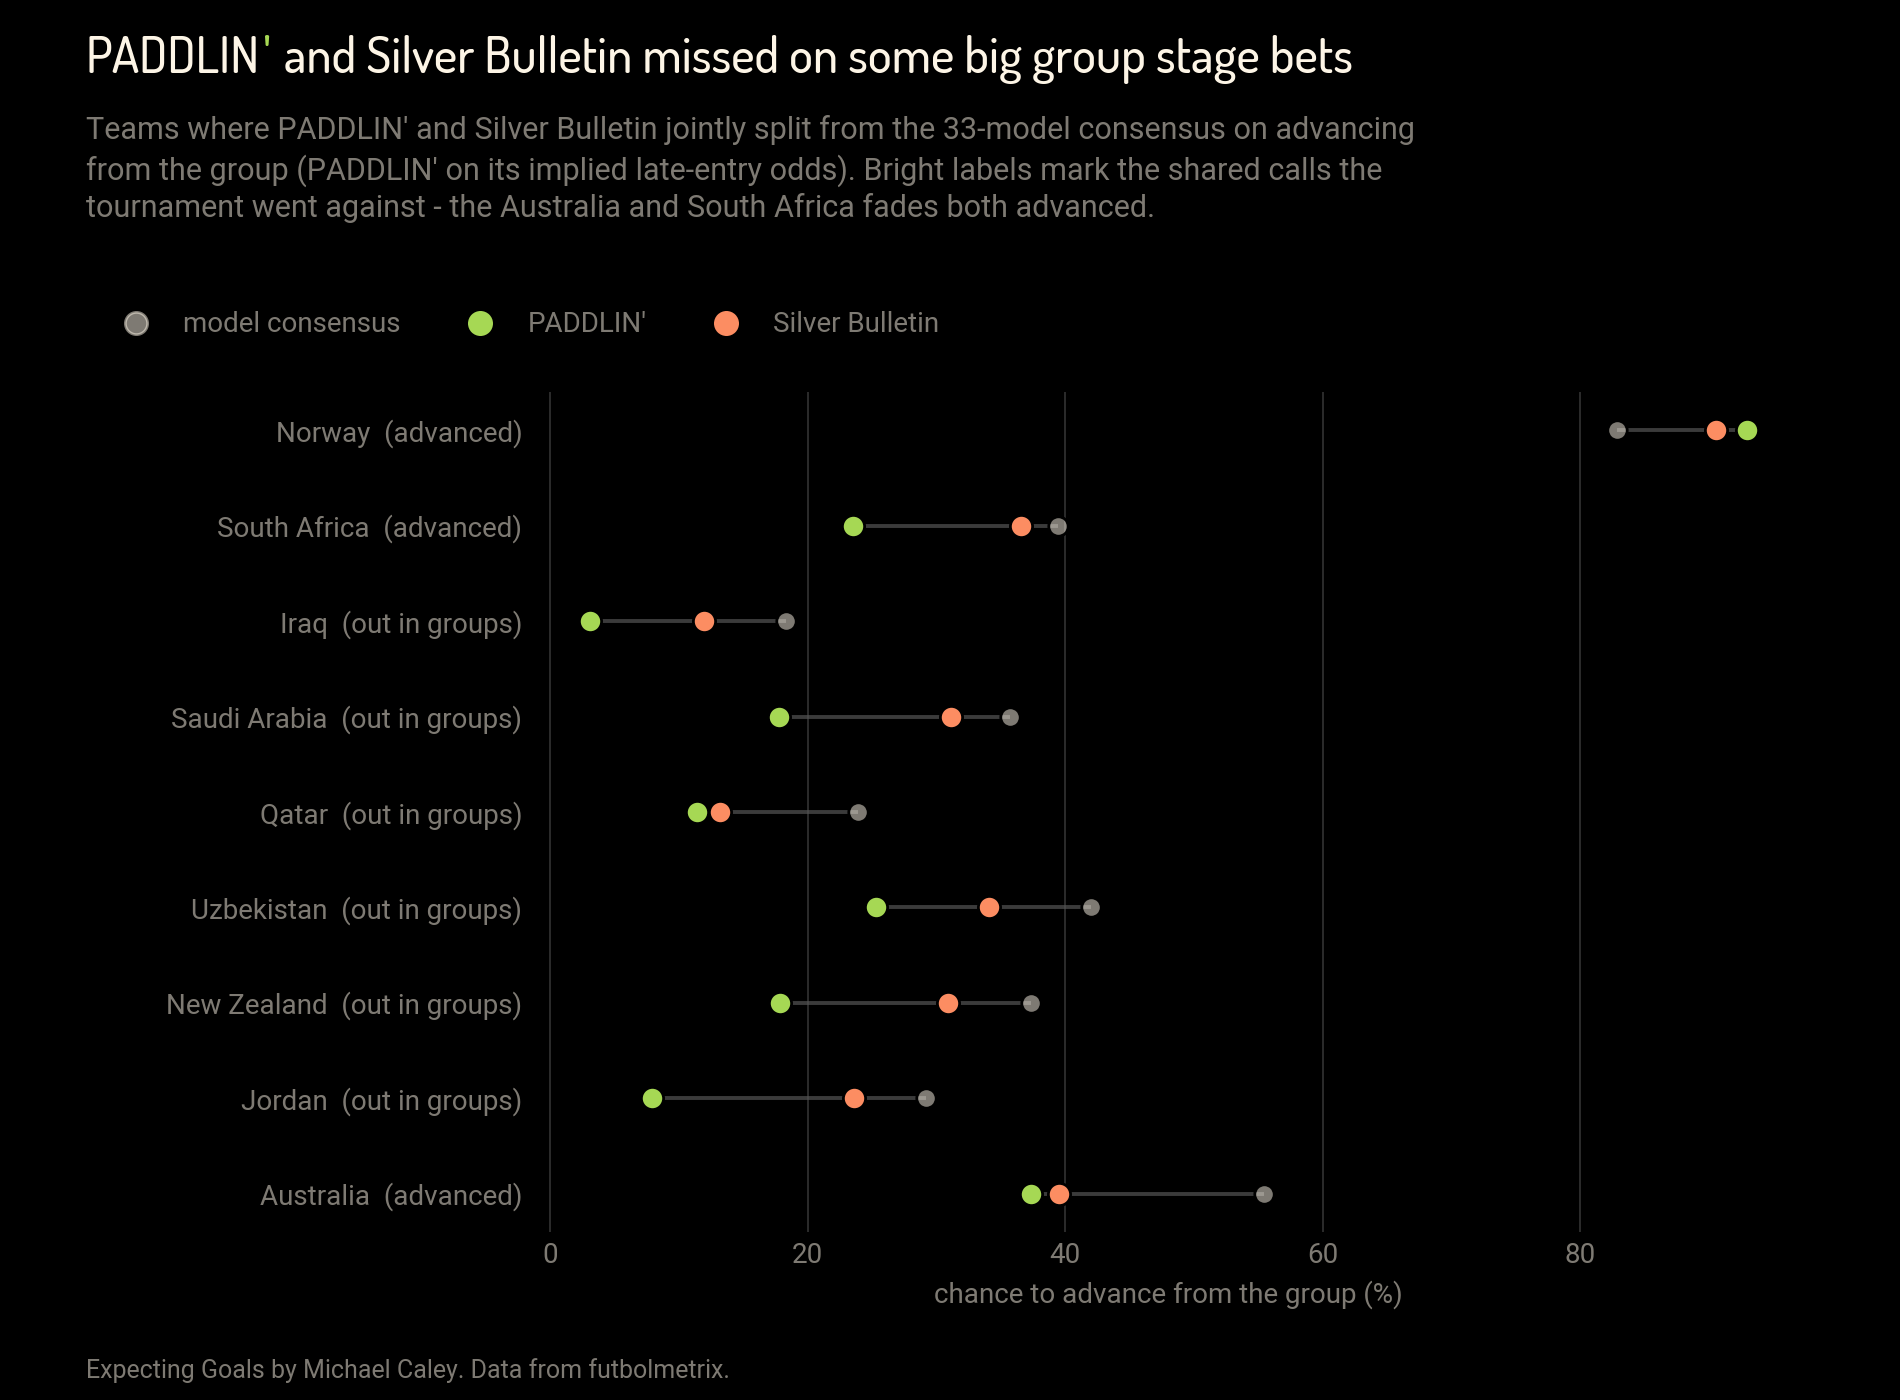
All of the teams where PELE and PADDLIN’ showed up off consensus in the groups were teams whose Transfermarkt values made a significant difference in their projections. Norway had one of the five largest boosts from Transfermarkt value in the field, and all of the others were significantly downgraded by the player value adjustment.
Of course, the misses here on South Africa and Australia cost both systems points.
And then in the round of 32, both models had a number of strong bets that paid off, with a decidedly different pattern:
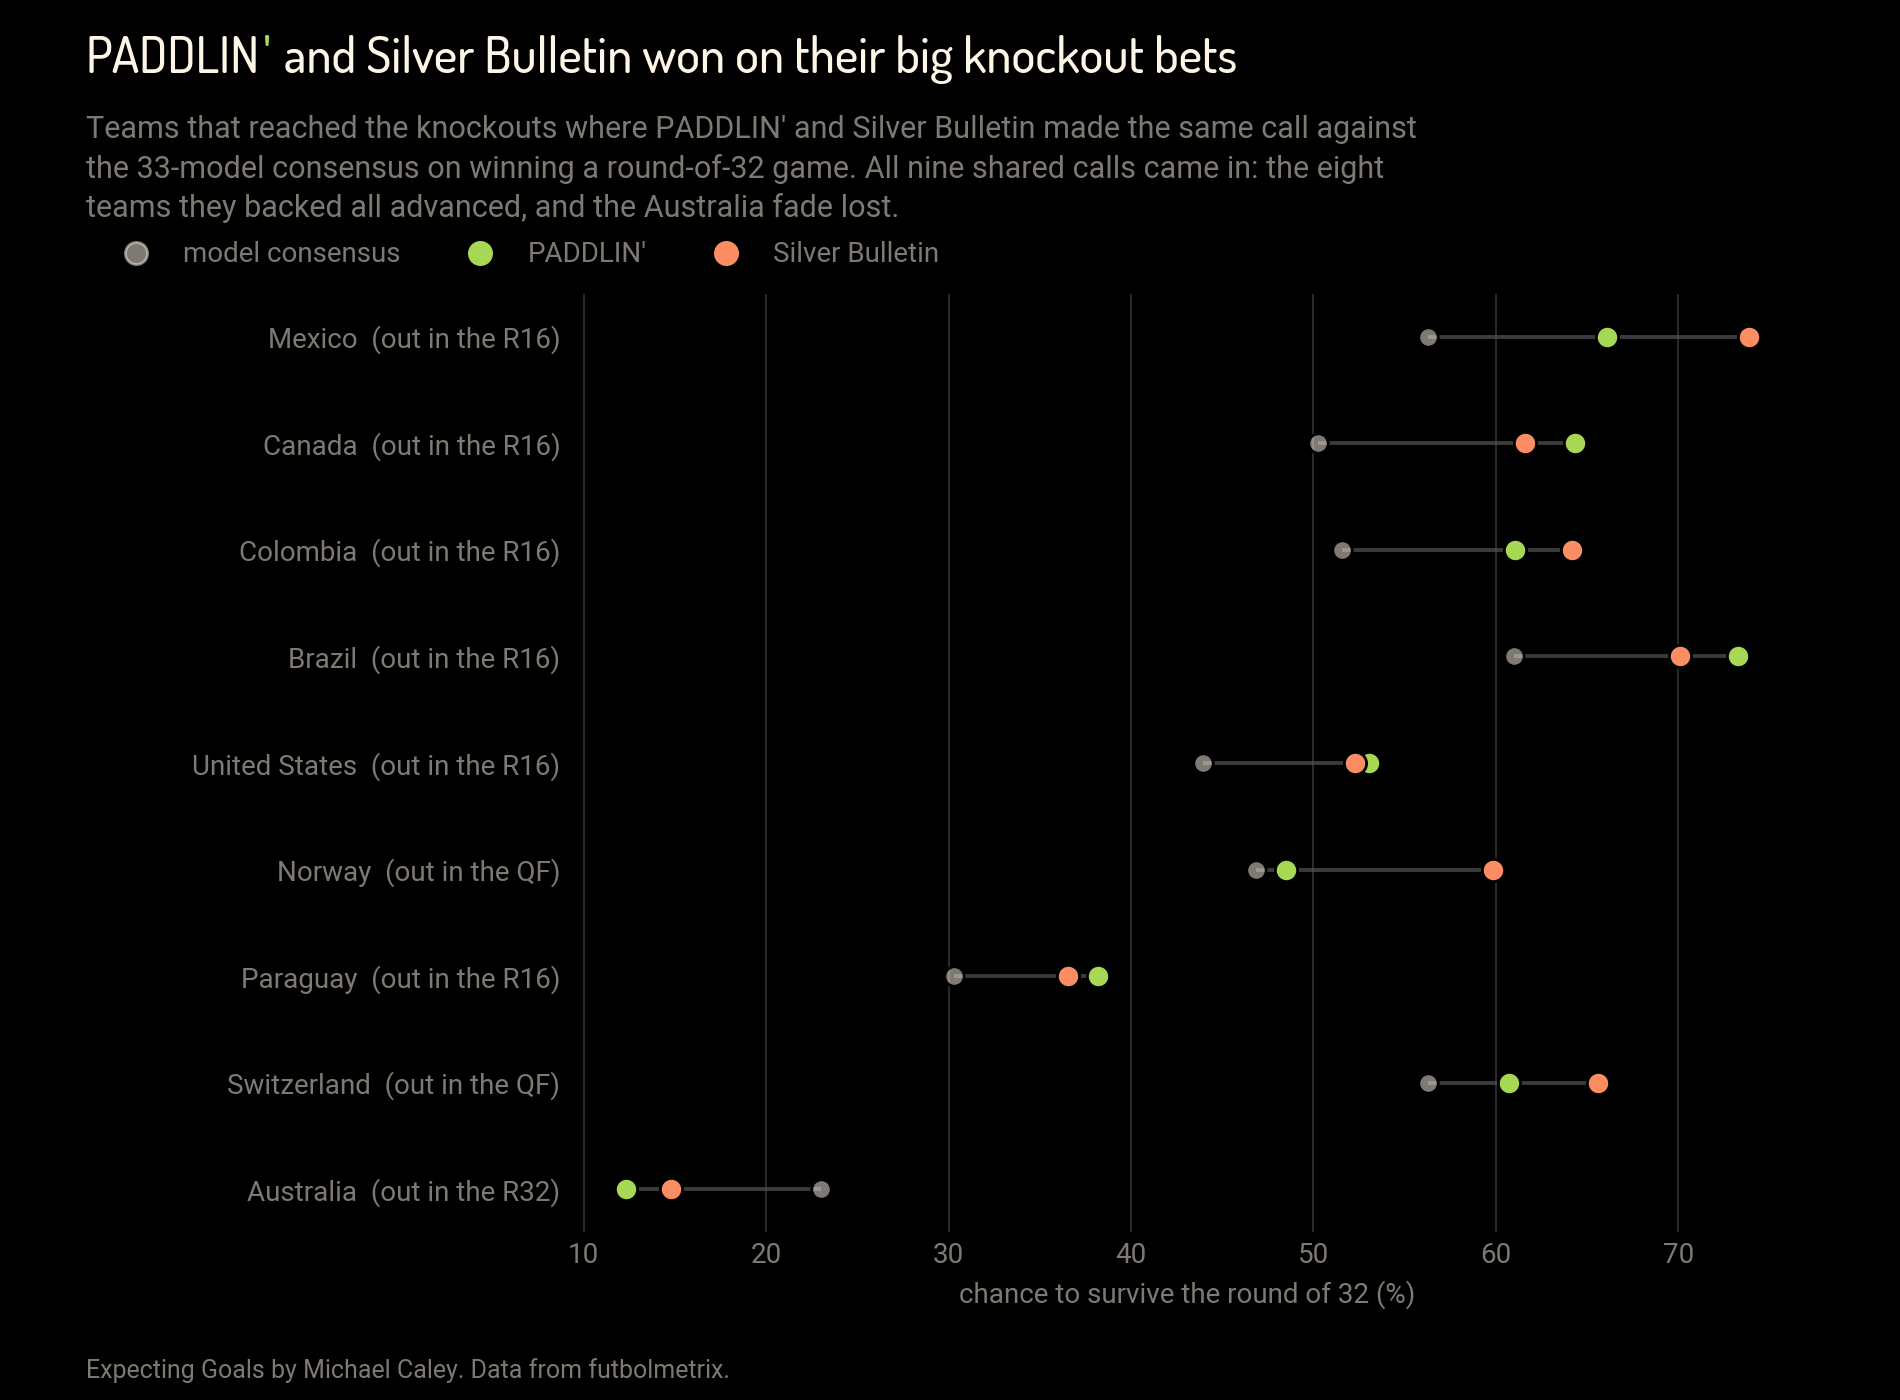
Here it seems there are two clear patterns. First, the two models trusted CONMEBOL results and gave notably high odds of advancing to some teams that had not impressed outside observers: Brazil, Colombia, and Paraguay. In the cases of Colombia and Paraguay, these teams were dragged down by their Transfermarkt squad value, but their records in qualifying and in Copa America were nonetheless enough to justify a higher rating than the consensus.
But the most obvious factor driving these calls is home field advantage. PELE and PADDLIN’ were far above consensus on Canada, the United States, and Mexico. This must be the host effect. Both systems gave a large effective Elo boost to World Cup hosts (about plus-60 in PADDLIN’ and about plus-90 in PELE) and both gave about the same additional boost for home teams playing at elevation (an additional plus-60 or so). I spent a long time working on home field advantage, and I talked on the Double Pivot podcast about what a nightmare it is to estimate it, and it seems this work paid off.
In the end, the results in the final three matches broke my way. PELE was much higher on England and somewhat higher on Argentina and lower on Spain than PADDLIN’. There are many versions of these semifinals where PADDLIN’ does not pass PELE, and ultimately the contest has to be extremely close for it to come down to the final.
What I find more interesting, and what made most of the difference here, are the similarities between these two models’ output.
Both made aggressive calls throughout. One of the hardest things in international football modeling is simply trying to get the model to predict that bad teams will lose to good teams at very high rates. The expanded field in World Cup 2026 meant that there were more teams with very low chances of success, and PADDLIN’ and PELE were designed to identify those teams.
Both models took home field advantage seriously. Even though the calculations came out somewhat differently—I decided to regress my home field advantage finding somewhat more—ultimately having an objectively derived home field advantage factor made a big difference. And finally, the two models bet on the teams which had demonstrated levels of success in South American competition. This had mixed results over the tournament, but was ultimately a winner given Argentina’s run to the final.
These choices and findings were far from exciting, but they were no less crucial for that.
Good Advice Is Often Boring Advice
When I look back on my doubts about PADDLIN’s picks for the semi-final, the consistent argument that I was making was that the model was updating too slowly. Argentina’s rating was based to a significant degree on the side’s performances from 2022 to 2024. France’s rating had not updated quickly enough based on their complete dominance at this World Cup. Perhaps England should have been given more of a reset to their rating after hiring a new coach.
The results—and in both matches the team that won had the better of the chances as well as the goals—suggest the longer-duration bet was the right one. It is easy to get out over your skis during a tournament and believe that just a few matches tell you more about what a team can do than its previous years of performance.
These are, I think, classic examples of the insights that you can get from model-building. Sometimes you discover something strange and exciting. But usually what you find is far more prosaic. Home field advantage matters a lot in international football and it’s a good idea to put a lot of effort into calculating it precisely. You should not be too sure that a few matches at a tournament give you a better idea of how good a team is than its demonstrated level of play over previous years. International teams with consistent results in high level competition, even if they don’t have squads stacked with the most famous players in the world, should be good bets to succeed at the World Cup.
PADDLIN’ and PELE came in at the top of this contest based on a shared set of bets that no one could ever call counterintuitive or groundbreaking. But by building models and testing them against past performance, we had good reason to bet than these particular boring theories about international football were the right ones to depend upon.
What’s Next for Expecting Goals?
The World Cup was a whirlwind for me. I built the model in a month, published it the morning of the opener, and blogged my way through five weeks of matches. I came out exhausted, but also confident that I wanted to keep doing this. I think the World Cup showed a way to balance the larger studies this newsletter was originally created to publish, with blogs that put an analytics spin on the latest news in the soccer world.
The first big project I plan to tackle is a club version of PADDLIN’. Much of the model’s design came from studies of league data, and rather than saving everything for one giant write-up, I’ll be looking to publish the findings in progress as they are relevant, just as Uruguay’s draw with Cabo Verde gave me an opportunity to write up adjusted xG. The new PADDLIN’ won’t be ready when the Premier League kicks off August 21, but it will be underway.
I also came out of the Messi–Ronaldo series with a deeper historical player database, and I’ll be putting it to work on player analysis. This will start with an Elliot Anderson piece on Monday. If there’s a player you want covered, let me know. Thank you for subscribing. I’m looking forward to this new era of the newsletter.
It uses a “logarithmic scoring” rule. I’ll quote Futbolmetrix’s explanation:
So, for example, assume that you assigned to France the following line: (P_R1=0.2, P_R32=0.2, P_R16=0.3, P_QF=0.18, P_SF=0.06, P_LF=0.03, P_WF=0.03), and France is eliminated in the quarterfinals. Since you assigned to France a probability of 0.18 to being eliminated in the quarters, your score for France is then ln(0.18) = -1.71. If instead France is eliminated in the semifinals, your score for France would be ln(0.06) = -2.81. You calculate these probabilities for each team, and then add them up. The player with the highest score wins. (All scores are negative, so the player with the lowest absolute value of the score wins.)
This may seem cumbersome, but it’s actually all quite intuitive. You want to assign high probabilities to events that you think are likely to happen, and low probabilities to events you think are unlikely to happen.
Some of the entries are just people putting in their picks to see how they compete with the machines, a few entries were created by asking an LLM to make a model from presumably a single prompt, a few are extrapolated from gambling markets, and a few are built by Futbolmetrix from some baseline materials rather than as a primary developed model.
According to Futbolmetrix, this person said they leaned heavily on bookmaker odds in creating their picks, but regardless their results are impressive.
Futbolmetrix built some models on economic data alone, and one of them performed even worse.