

World Cup Update June 22: Uruguay 2–2 Cabo Verde and Expected Goals. Plus, Does FIFA Have a Dead Rubbers Problem?
we live our lives by a simple rule at Expecting Goals: publish your negative results

On June 15, Cabo Verde stunned the world again with a draw against Spain. Less than one week later, it was Uruguay suffering the same fate against Tubarões Azuis. This tiny island nation taking points off a tournament favorite in Spain and a historically successful national team in Uruguay makes for a stirring narrative. And this is typically where analytics writers will play the wet blanket, drawing on the well-established randomness of football results to ask whether anything really happened here besides the normal variance of the ball going in the goal.
But in this case, the headline statistics may actually be hiding something. While Cabo Verde’s draw against Spain looks very much like a classic story of variance, there are real indicators of a competitive team performance in the match against Uruguay.
Reconsidering Uruguay 2–2 Cabo Verde
The headline numbers here initially suggest it was randomness again. Opta’s xG gives Uruguay nearly as much of an advantage in this match (2.3–0.9) as it did for Spain against Cabo Verde (2.1–0.2) in the first round of group matches.
But when you look beyond the topline xG, clear differences emerge. Spain completely strangled the match, dominating not merely possession but also access to the penalty area and final third, and taking many more shots on goal. Uruguay certainly had the advantage in field control, but they were far from equally dominant.
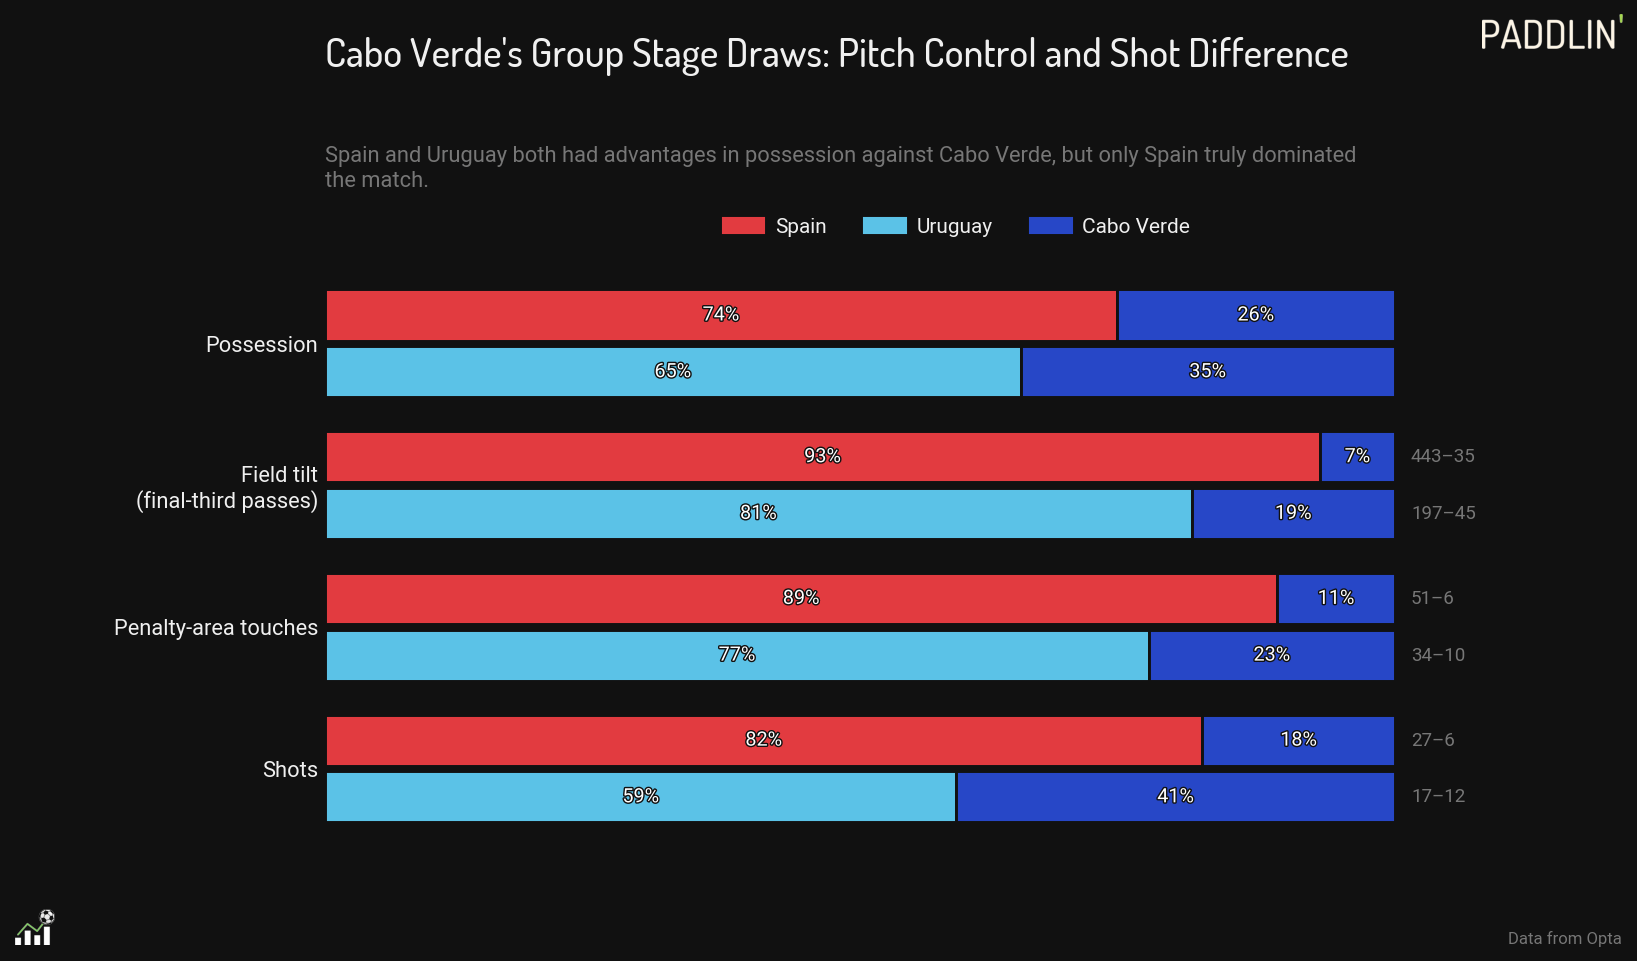
These underlying Uruguay–Cabo Verde statistics seem to reflect a match in which one team had most of the ball and most of the territorial advantage, but not in a way that left the play on the pitch uncompetitive with only a question of whether one of that team’s shots would hit the back of the net.
Especially Cabo Verde within striking distance on shot count (17–12), these numbers begin to look like a match in which an underdog side defended stoutly and counterattacked efficiently. My subjective observation in watching the match accorded more with that story, as I saw relatively few moments when Uruguay appeared one pass away from unlocking the defense and a reasonable number of Cabo Verde counterattacks that offered some early danger before being corralled by a defender.
So what is going on here? If the match felt competitive, why does the xG look so lopsided?
I would not argue the xG is incorrect here. It is always possible for even a well-tuned statistical model to mislead about the quality of a few individual chances, as I have argued was the case in USA–Paraguay, but here that seems unlikely. The three best chances for Uruguay by xG were Maxi Araújo’s goal-line, open net, headed equalizer (rated at a reasonable 0.89), Agustín Canobbio’s free volley over a scrambling keeper from six yards (0.56), and Fede Valverde’s fast break miss from the left channel early in the match (0.25). These chances make up the bulk of Uruguay’s summed xG (1.7 out of 2.3) and they seem properly tuned.
But if you have been following my blogs at this World Cup, this description might sound familiar. The PADDLIN’ model’s Adjusted xG has two components. The first is a game-state adjustment which downweights the value of chances created by a favorite who is chasing the match, as Uruguay were before Araújo equalized. And the second component is a big chance regression.
