

World Cup Update June 28: The Big Bracket, New PADDLIN' Projections Pages, Blog Roundup
the big rebuild

The largest group stage in World Cup history is complete. The largest knockout phase now begins.
There are still so many matches to play. The way powers of two work means that the expansion of the the knockouts by one round has doubled the number of win-or-go-home fixtures from any previous World Cup.
And I have a new round of PADDLIN’ projections for the knockouts. There is a big new knockouts chart that will be updated after every match. I have new tables walking through how each contender can win the World Cup based on their paths through the bracket. And finally there are a new set of “how well have they played?” tables looking at every team’s adjusted xG performance in all their matches to date.
But before I get into the new charts and new tables rollout, the first slowdown day at this World Cup is a great time to catch up on all the soccer analytics content from Expecting Goals.
This newsletter was originally built to be a place for larger studies in soccer analytics. In the World Cup blogs, the concept has been to merge this focus on the study of the game through data with more of-the-moment daily coverage. So each of these blogs covers not just some of the events of the group stage but also larger questions in analytics that the games raised.
June 26: On “Wanting It More” — What Happens When Teams Have Nothing to Play For?
June 19: (Ok This One Was More Just Fun With Charts In Retrospect)
June 18: Why Should You “Adjust” xG and How Does PADDLIN’ xG Work?
And of course there is always the Introducing PADDLIN’ explainer for the full World Cup model. On my podcast, the Double Pivot, we also put together a three-part series on what it takes to build a World Cup model and thinking through the whole process of model-building from the broadest question (“what is a ‘model’ anyhow?”) through to the specific PADDLIN’ projections. You may also be interested in our “How to Watch Soccer Like a Nerd” episode going over how we watch and think about the game.
We’ve also covered England being good, the USMNT being good, Ronaldo and Yan Diomande, England not being that good (and Colombia and Brazil), and for subscribers we profiled Elliot Anderson, kept track of the USMNT, and talked about the economics and the politics of the World Cup.
Really the point of today’s newsletter is that I have been exceptionally busy for a few weeks.
The New Tables
The most important new table isn’t a table at all, but the new World Cup bracket. It shows the current active knockout round and the odds in all of its matches, plus the favorites to make it to the next several rounds and the current champion odds.
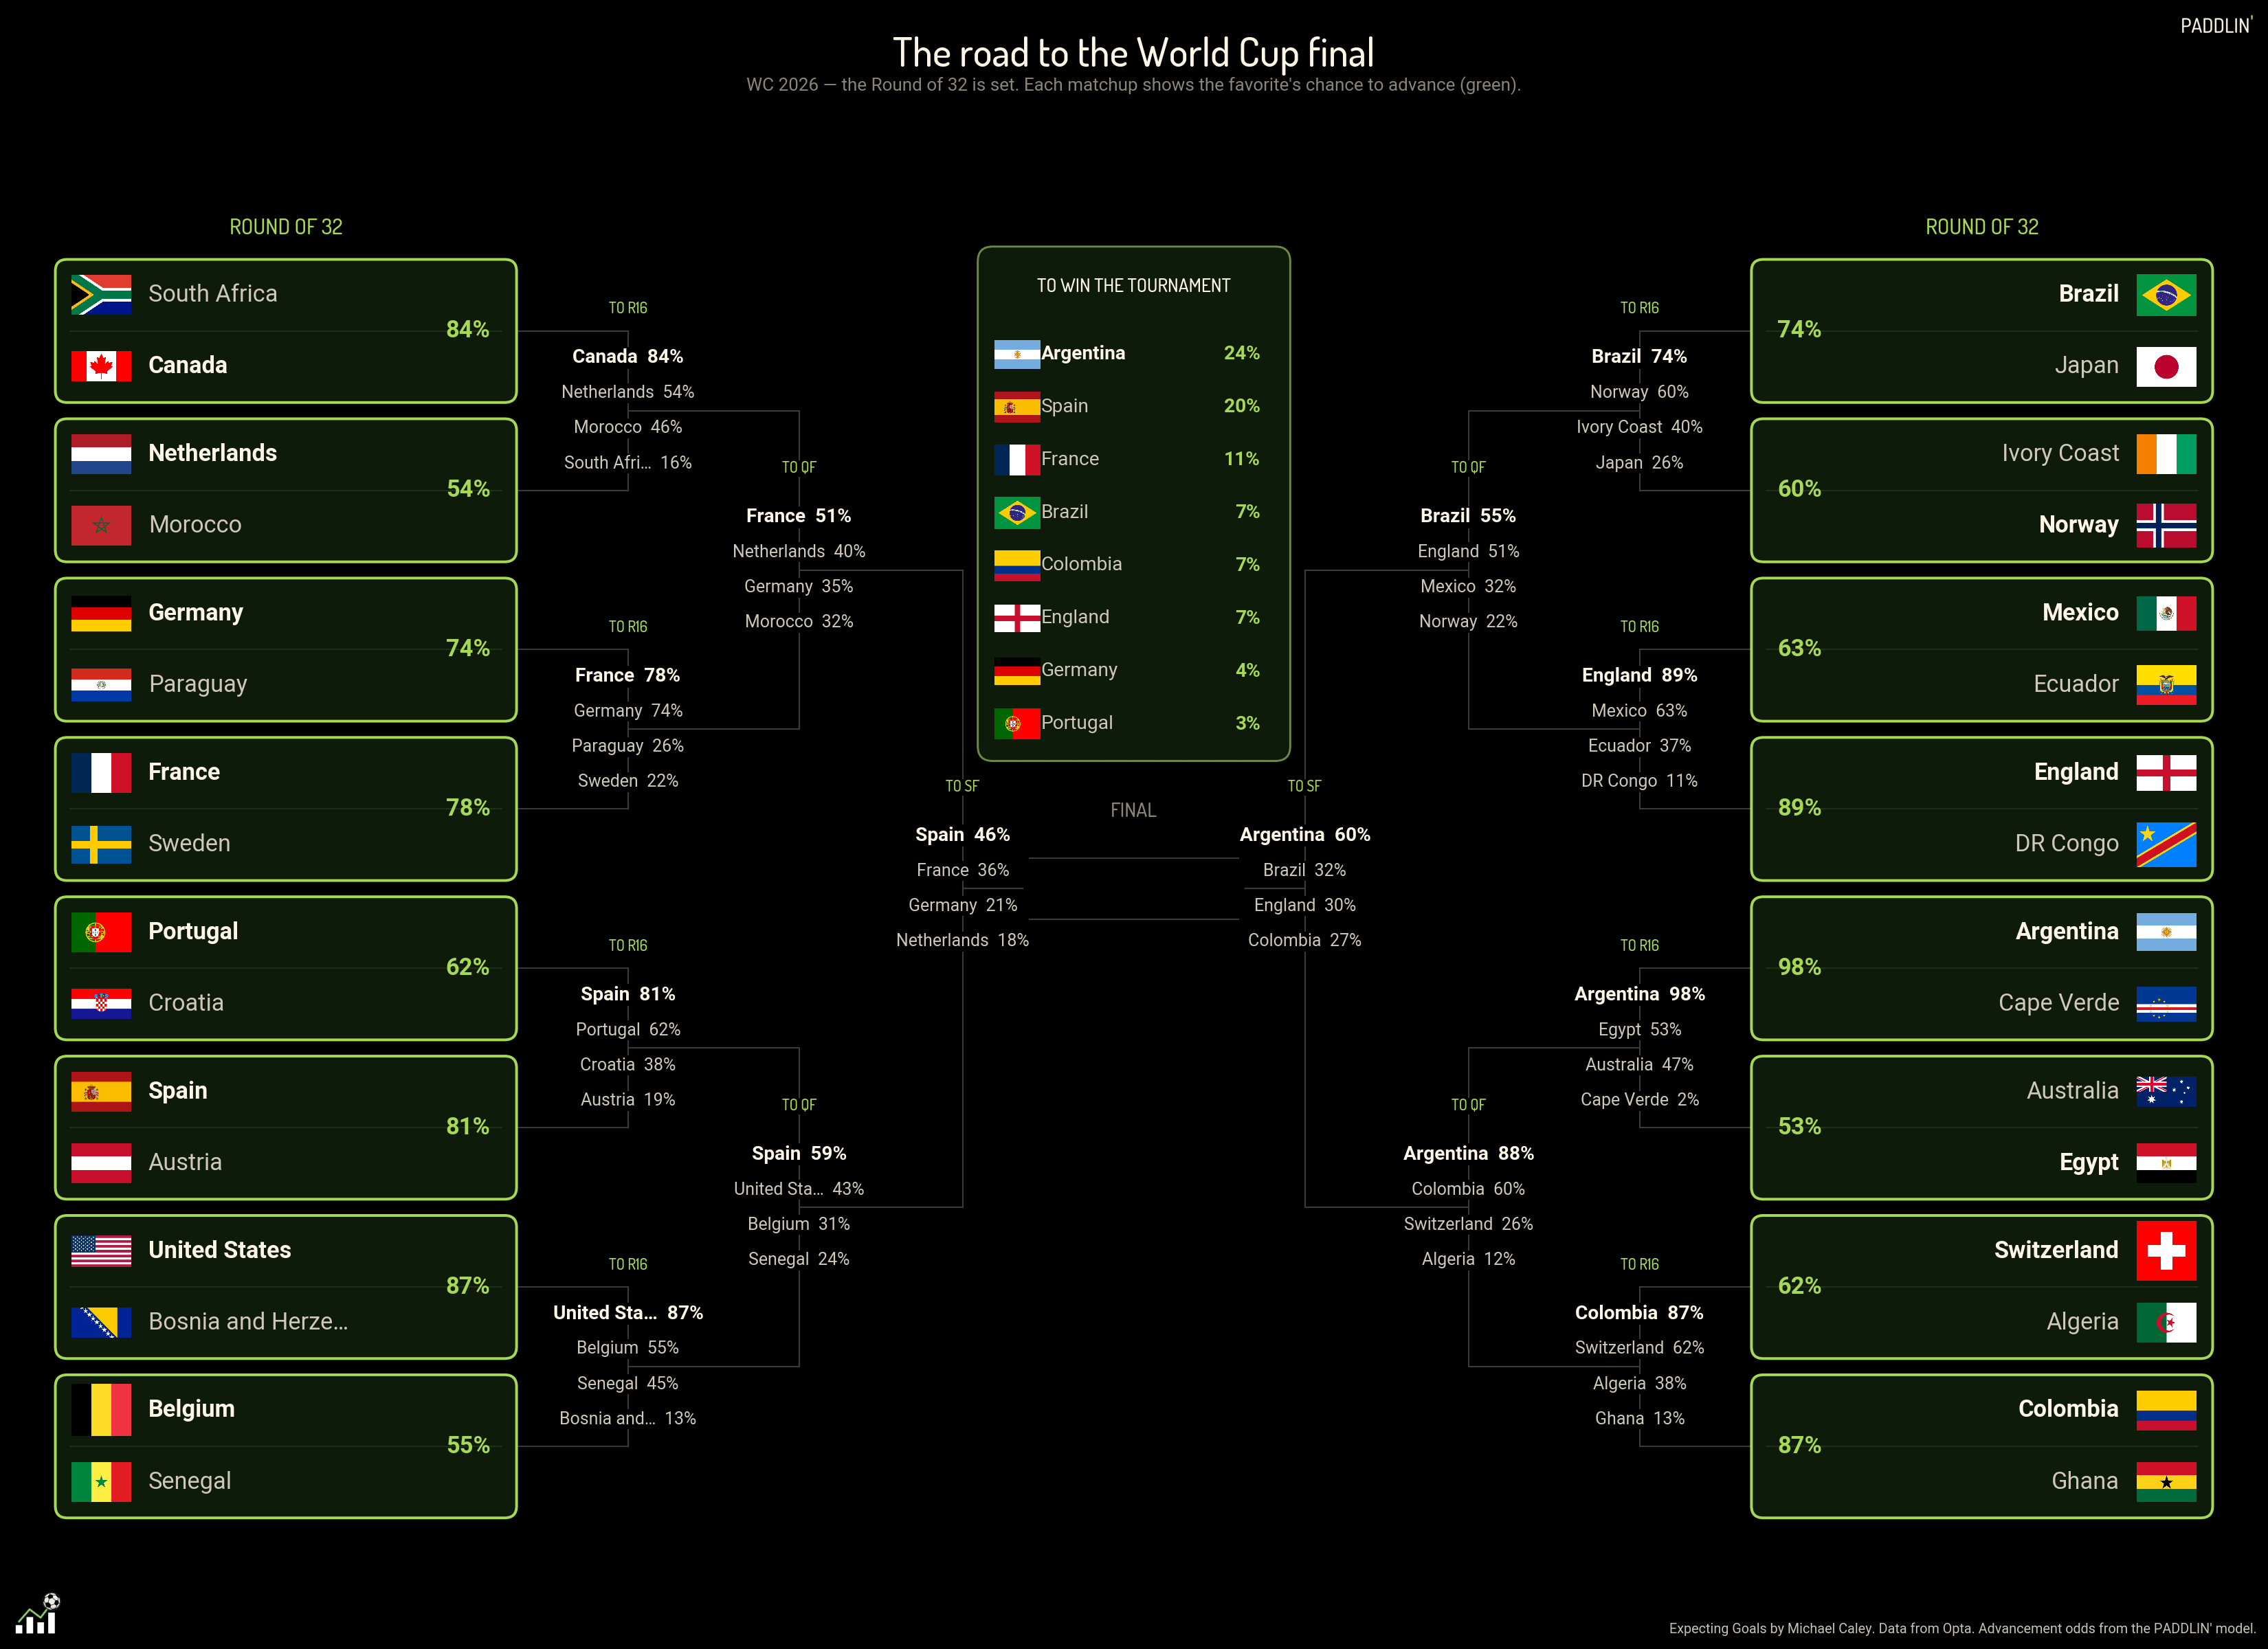
This graphic will be updated on the primary PADDLIN’ projections page.
Along with this, I have put together “How They Win The World Cup” charts for the 14 favorites (all teams with a projected chance of winning it all of 1 percent or higher). These show for each team their projected chances of winning not just their upcoming match but also their most likely future knockout matches, and how their odds of winning it all would increase with each step and each different opponent.
This is what the model sees as Argentina’s current path:
And this is what it looks like for the United States:
These charts will be updated on two pages, with the teams in alphabetical order, so you would find Brazil on the A-G page and Mexico on the H-Z page:
Finally there are the Team Performance tables, which use PADDLIN’ adjusted xG to evaluate team performance. In these tables the teams’ performances are compared to the projection of an average round of 32 team against the same opposition, with the same home field advantage or disadvantage. Dead rubbers are excluded. One table shows adjusted xG difference, and the other shows expected points for every match compared to that round of 32 baseline.
Both tables will be updated on the World Cup Team Performance Index page.
The Detailed Knockout Paths page has been updated as well with all the upcoming rounds.
End of newsletter.
World Cup alphabetical inequality may be a topic for future study.