

World Cup Update June 21: Türkiye's 62-Shot Elimination, New Detailed Paths, and Caley Graphics Returns
exploring the recent history of World Cup futility

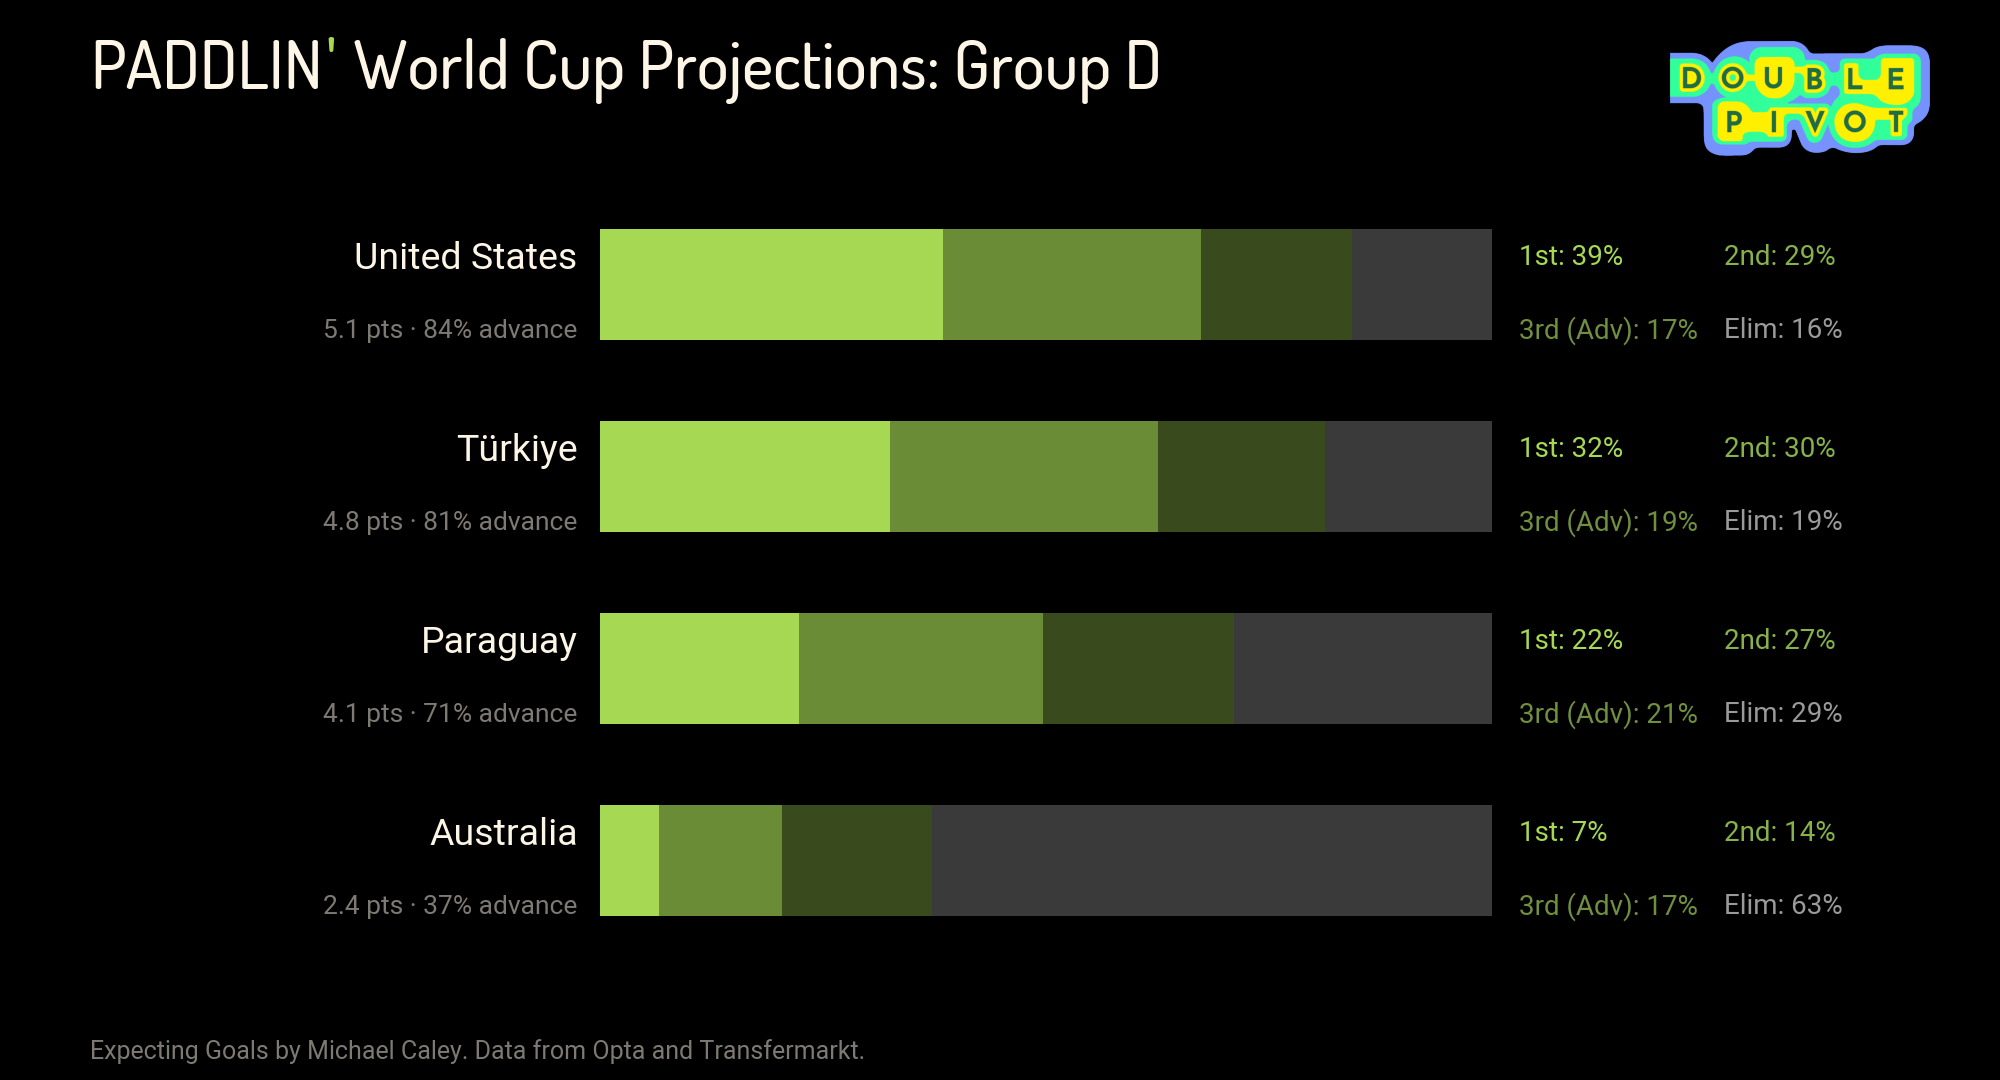
The biggest surprise of the groups so far, at least in relation to my model’s projections coming in, has been Türkiye’s elimination after just two matches. In the PADDLIN’ pre-tournament projections, Türkiye were only slightly behind the United States in Group D, with an 81 percent chance to make the knockouts and even a 32 percent chance of winning the group.
Oops.
But even beyond how unexpected it was, the most notable thing about Türkiye’s shock exit is exactly how it happened. Twice Ay-Yıldızlılar1 were favored, twice they conceded an early goal, twice they piled on enormous numbers of mostly low-xG shots and failed to score a single one. The combined barrage was one of the most impressive and also one of the most ineffectual in recent World Cup history.
Between the 0-2 loss to Australia in the opener and the 0-1 defeat to Paraguay in the late night match on Juneteenth, Türkiye attempted 62 shots. The combined barrage was one of the largest in recent World Cup history, and by any account it suggests Türkiye were unfortunate to be eliminated so abruptly. But this barrage also showed exactly the kind of shot profile that football analytics has long viewed skeptically: huge volumes of low-quality attempts from poor shooting positions.
No other team at this World Cup has attempted more than 45. In fact, no other team at any World Cup since 2014 had attempted more than 45 shots in their first two group matches before Türkiye blew past that standard. And it was not just the number of shots that stood out. Again and again Turkish players settled for low-quality chances from outside the penalty area and through traffic. The shot total is inflated by massive numbers of attempts from outside the penalty area and even from over 25 yards.
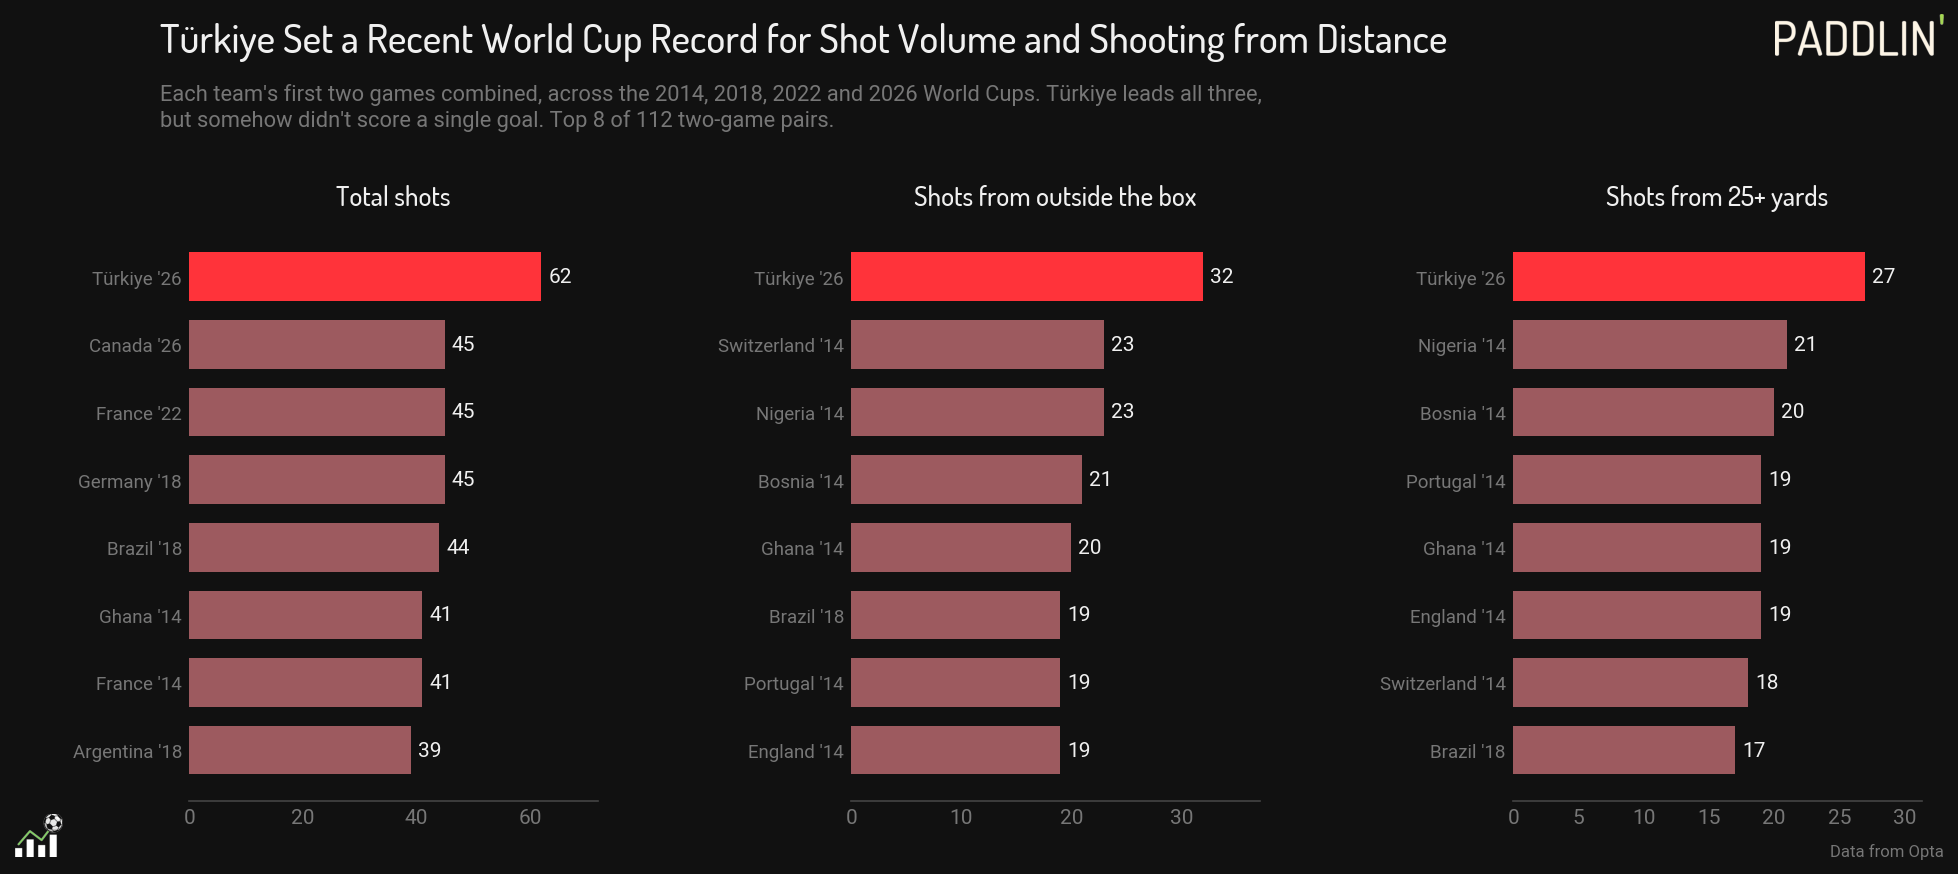
One thing you can also see in this graphic is the evolution of football tactics over the last two decades. The wisdom of such barrages has been challenged both by tactical experts who sought to pry apart opposition defenses with new attacking plans, and by statistical analysts whose expected goals systems demonstrated the typical futility of long range attempts. Other than Türkiye, the graphic shows almost exclusively teams from the 2014 World Cup at the top of the long-range leaderboard.2
Because of how few good chances Türkiye created, other than a couple late in the match against 10-man Paraguay, the expected goals numbers massively downgrade the rating of these performances. My system estimates the xG total between the two matches at 3.9, for a unimpressive 0.06 xG per shot. The following shot map displays all the chances, with the size of the chance relative to the area of the marker, and goals in pink.3
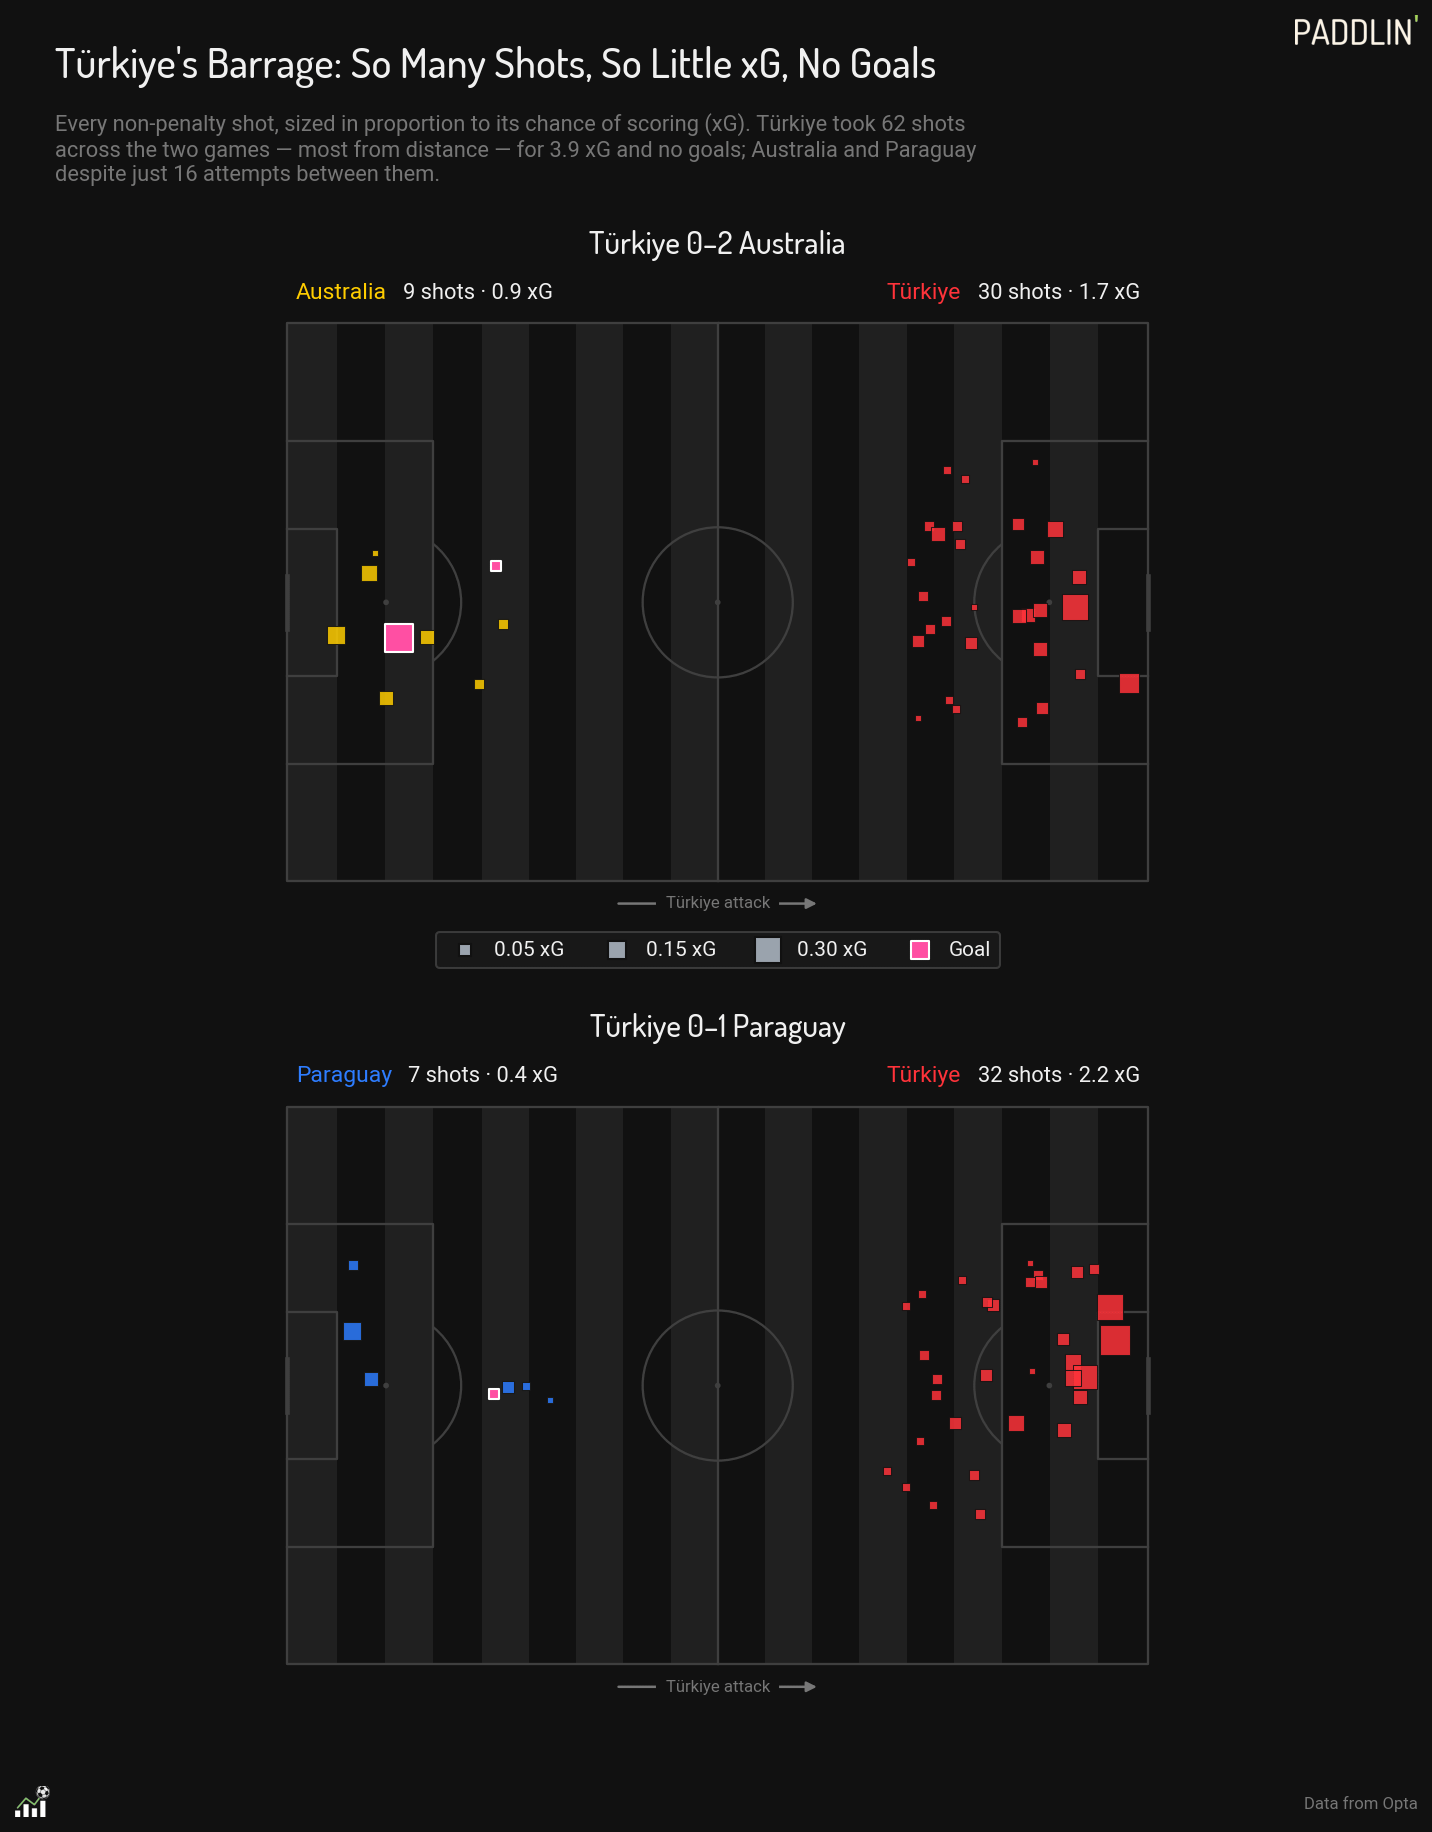
Yet even 3.9 xG may overstate how impressive these performances were. Readers following the PADDLIN’ charts will have noticed that Türkiye’s posted numbers are much lower. My “Adjusted xG” credits Türkiye with only 2.4 total xG, not 3.9.
Adjusted xG, Game State, and World Cup Comebacks
In my World Cup blog from Thursday, June 18, I talked about the new Adjusted xG system that runs behind PADDLIN’, and how it incorporates big chance and game-state factors in its calculations. Türkiye offers the best example yet of how this system works, and in particular how much difference the game-state adjustment can make.
