Power Rankings: Premier League and More
This is still mostly a soccer analytics newsletter lol
There is no better period for soccer analytics than the time in between 5 to 20 matches played in the league season. The sample of minutes played grows large enough to be meaningful, but it is not so large that variance in finishing and other more random effects will not often hide the true signal of team quality in the league table.
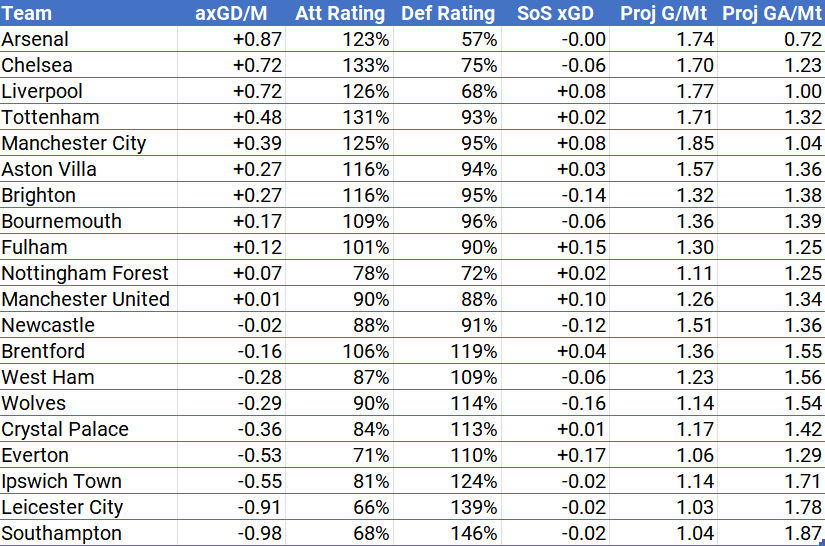
Two weeks ago, I shared my Premier League Power Rankings as well as the methodology by which they’re calculated. We have had another round of matches in the Premier League and so the Power Rankings have updated.
But the same method can be easily applied to other leagues around Europe as well, and so we will also be looking at Serie A, La Liga and the Bundesliga by the same method. I want to emphasize that these are still toy power rankings, they are a method I think is tested well enough to be interesting, but not optimized to a point that I would send it out there against anyone’s best model.1
Still, I have tested the model enough over the years to believe that it is providing real insight. And in the Premier League we do have some real continuing movement week to week.
For the power rankings, these are what the six columns mean and how they’re calculated.
axGD/M: My 24-25 estimated expected goals difference for the team at even strength, adjusted for strength of schedule, includes a small adjustment for actual non-penalty goals scored and conceded. The weight on actual goals will increase over the season.
Att Rating: Adjusted attacking performance in 2024-25 above or below league, scaled to league average = 1 (so 143% is 43% more expected goals production than league average)
Def Rating: Adjusted defensive performance in 2024-25 above or below league, scaled to league average = 1 (so 67% means conceding about two-thirds as much expected goals production as an average team). Lower is better here.
SoS xGD: The expected goals difference per match that an average team would be projected to have against their schedule based on my team ratings. So +0.11 means an easier schedule, an average team would be projected to have a +0.11 xGD against this schedule
Proj G/Mt: These are my underlying team attacking ratings for the projections, based on 23-24 and 24-25 data, a projection of goals per match. Because they incorporate 23-24 data (with a weight that decreases over the season), these are much less responsive to performance in individual matches. Note how Chelsea rank well above Manchester City in performance this season, but still have notably worse Projected G/Mt and GA/Mt going forward.
Proj GA/Mt: These are my underlying team defensive ratings for the projections, based on 23-24 and 24-25 data, a projection of goals conceded per match.
For paid subscribers, below is my commentary on the Premier League power rankings table as well as the tables for Serie A, La Liga and the Bundesliga with commentary.


