

How Zohran Mamdani Won, and What the 2025 Election in New York Can Teach Us About the National Political Environment
More than you think, but not in the way you’re thinking.

Zohran Mamdani’s victories over Andrew Cuomo, first in the Democratic primary and then in the New York City Mayoral election in November, shocked the political world. There have been innumerable analyses of these results, considering the appeal of Democratic Socialism, the role of Israel-Palestine issues in national politics, and Andrew Cuomo’s record of sexual harassment and his resignation in disgrace. People have been fascinated by the peculiarities of New York City’s 2025 election, but that focus obscures the import of these events.
New York City in the 2020s is not an outlier; it is a bellwether. The drift of non-white working-class voters away from Democrats began here in 2021, foreshadowing the national catastrophe of 2024. Now, the 2025 results are telling a different story.
Beneath the unusual structure of the Mayoral race, the data reveals a massive swing back toward Democrats, driven not by off-cycle turnout quirks but by former Trump supporters changing their minds. Despite all the drama of 2025 in New York City, the most important story might be how normal the election ultimately was. It is precisely that normality which makes New York City worth deep consideration for electoral analysis.
How Zohran Won the Primary
Now, to explain how the 2025 general election can offer insights into the national political situation, I need to explain the New York City Mayoral primary, which was anything but a normal American election.
Here’s a full map of city results from the primary.
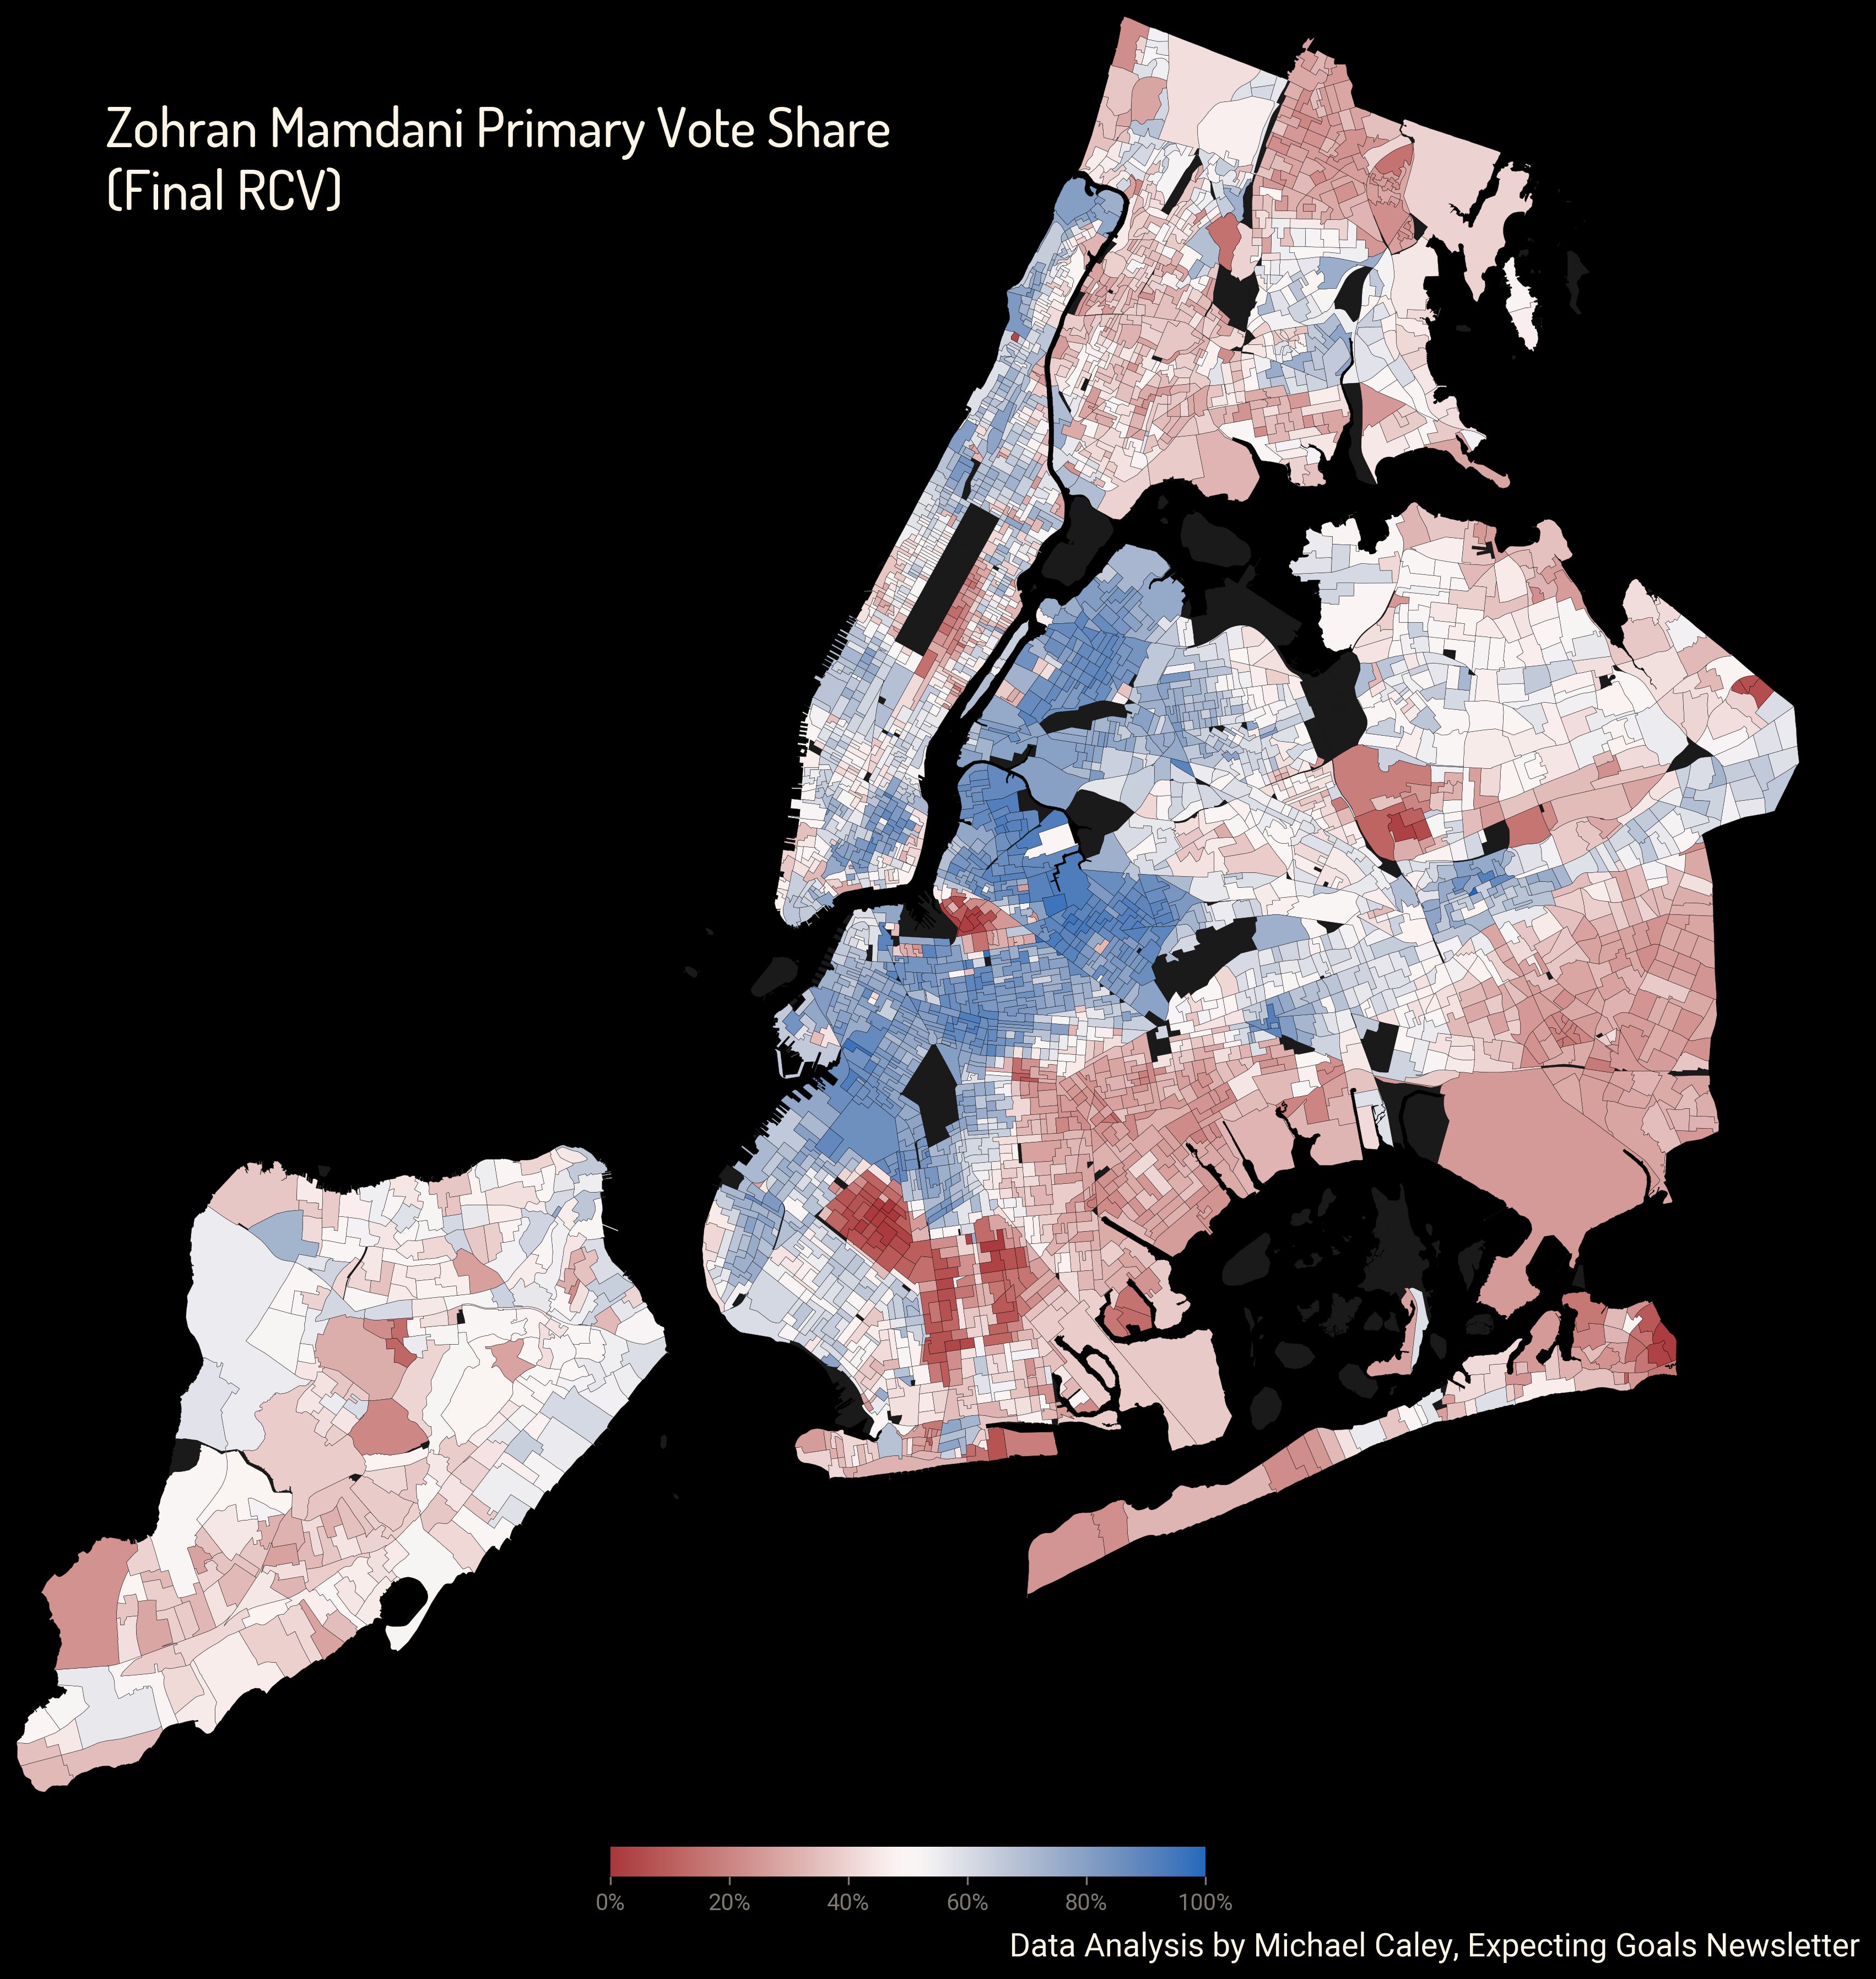
The first way this election was unusual is that New York City has ranked-choice voting in its primaries, which allowed multiple candidates to cross-endorse and encourage their supporters to rank allied candidates. Thanks to cross-endorsements, Mamdani consolidated the support of eliminated candidates in the ranked-choice rounds to expand his lead. He won the first round vote by a little under 8 points, 43.8–36.1, but then in the final round he defeated Cuomo by about 13 points, 56.4–43.6. (In this newsletter I will generally be using the final-round head-to-head vote when I talk about the primary, and that is what the above map displays.)
Second, the primary election was driven significantly by differential turnout. Consistently, rates of voting ran higher in the areas where Mamdani’s support was concentrated.
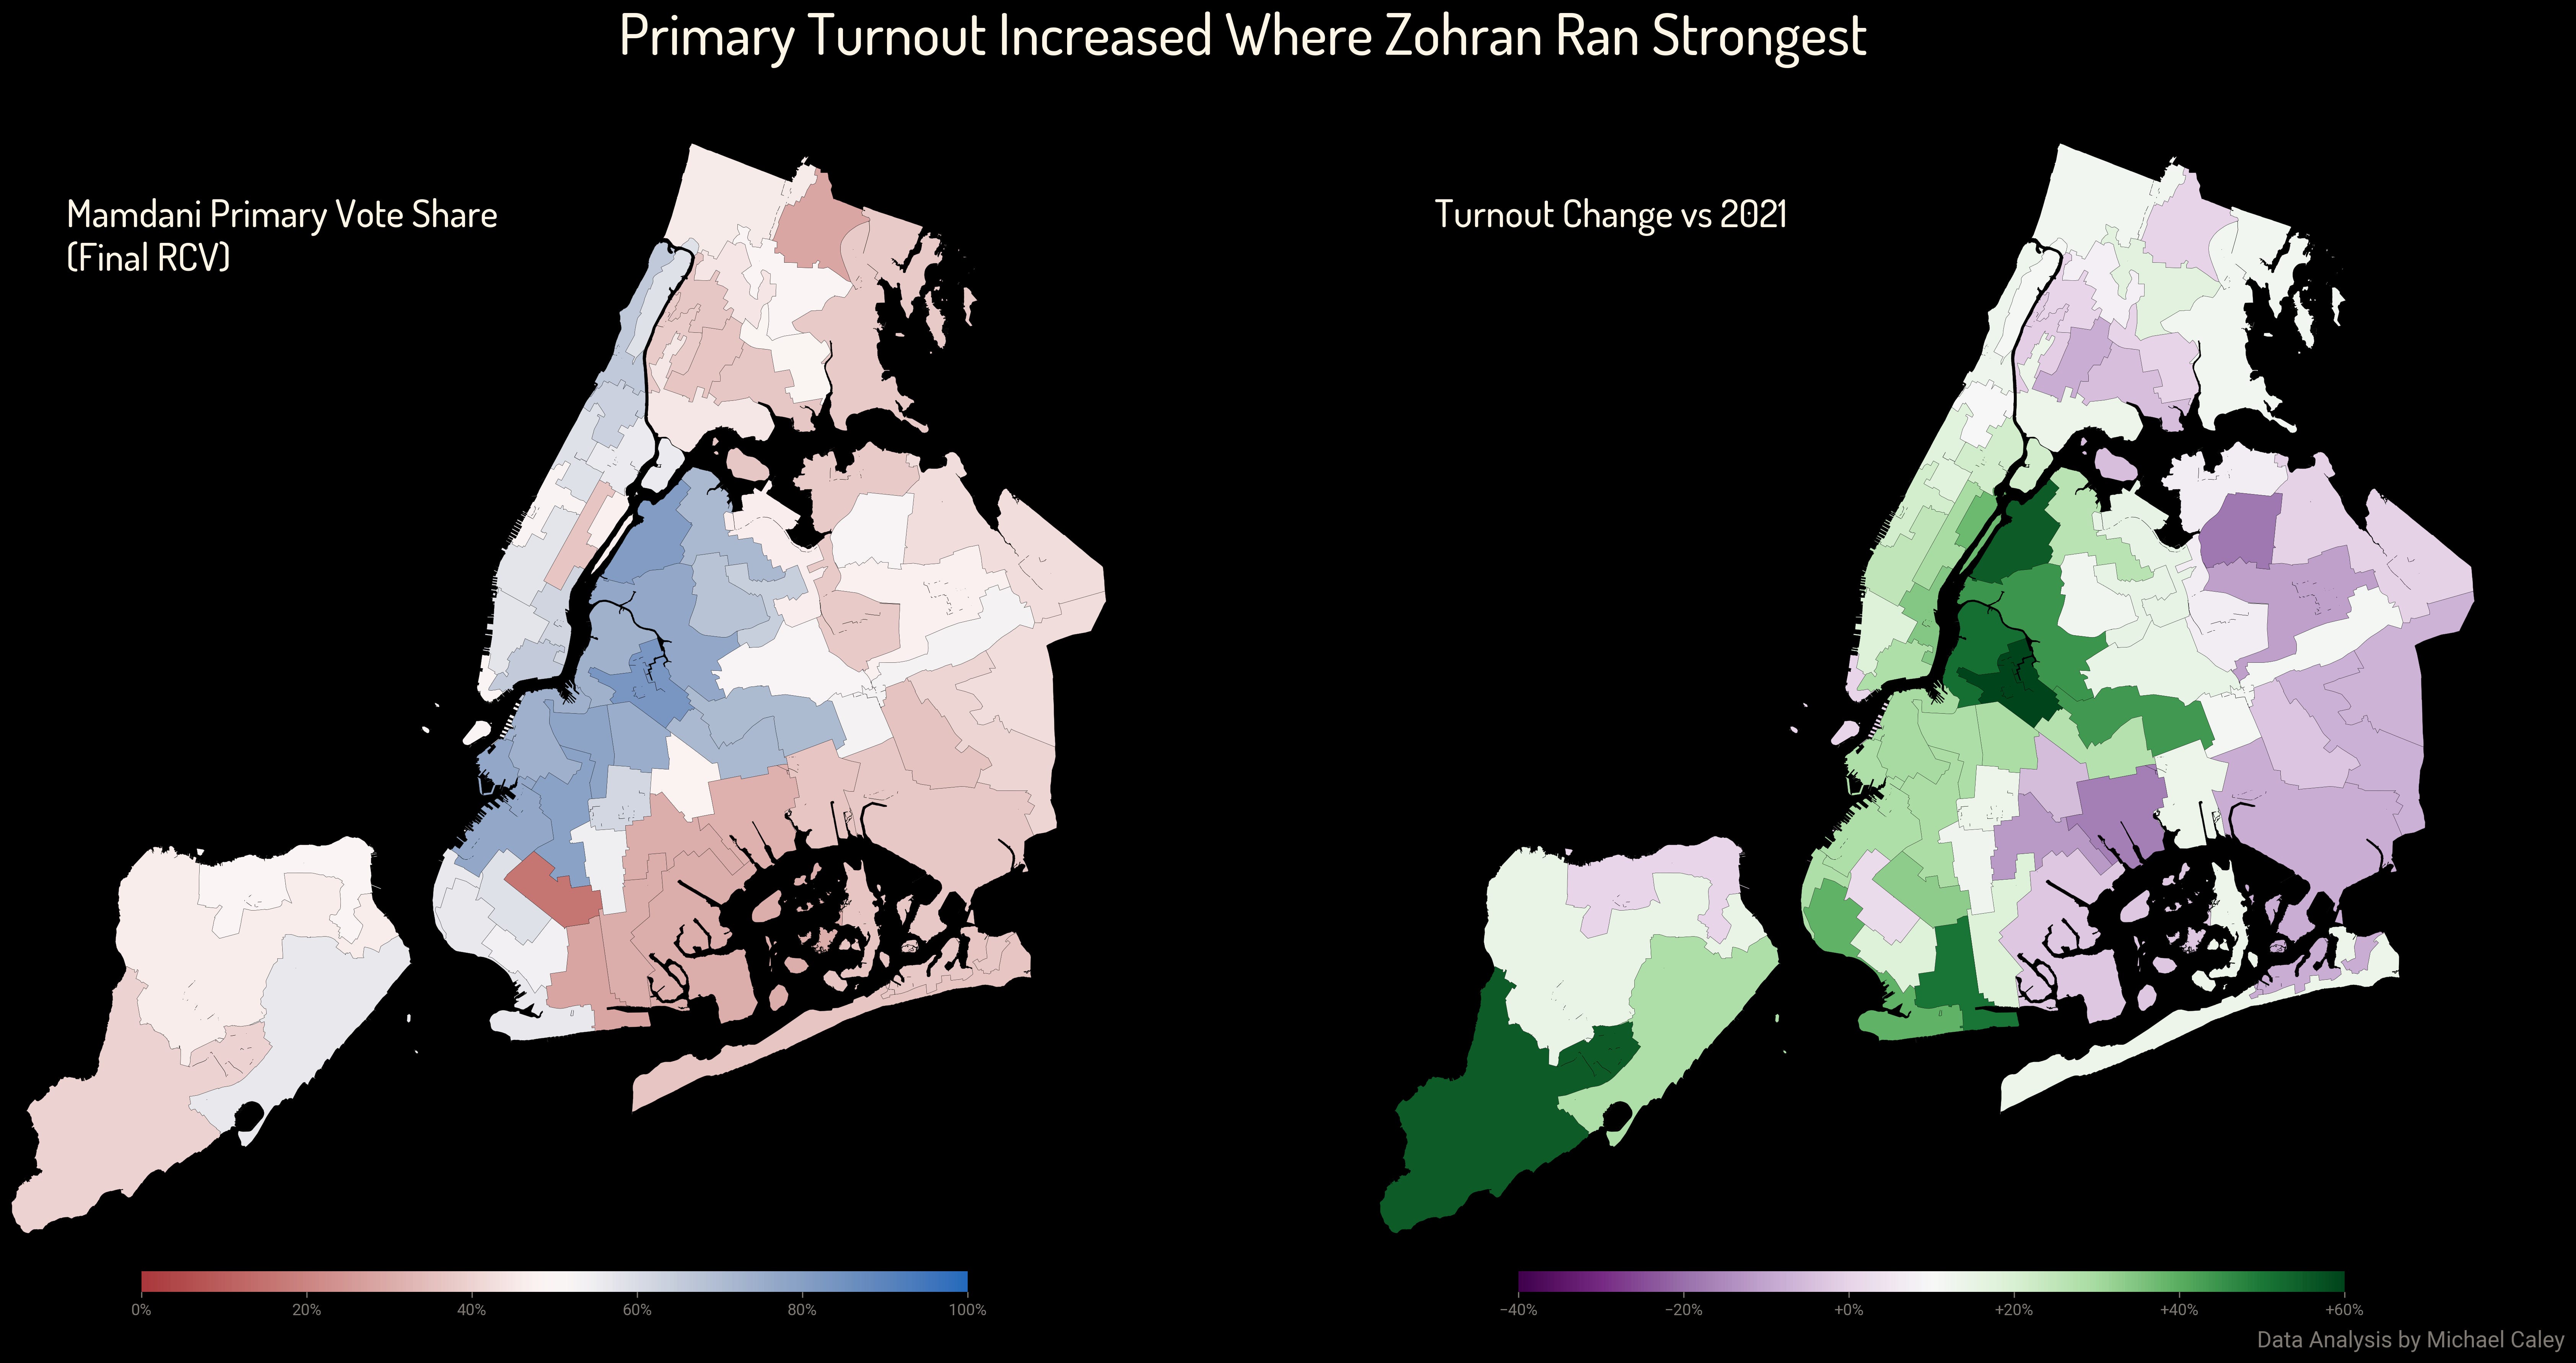
The area—in blue on the left and green on the right—running from the Queens waterfront down through Brooklyn and around Prospect Park gave Mamdani his largest margins anywhere in the city. These areas also saw some the highest rates of voter turnout, compared to the 2021 Mayoral primary, in the city.
By contrast, most of Cuomo’s strongest regions, from Southern Queens to Central Brooklyn and the Bronx, had some of the lowest rates of turnout in the city. These are light red on the left and purple on the right.
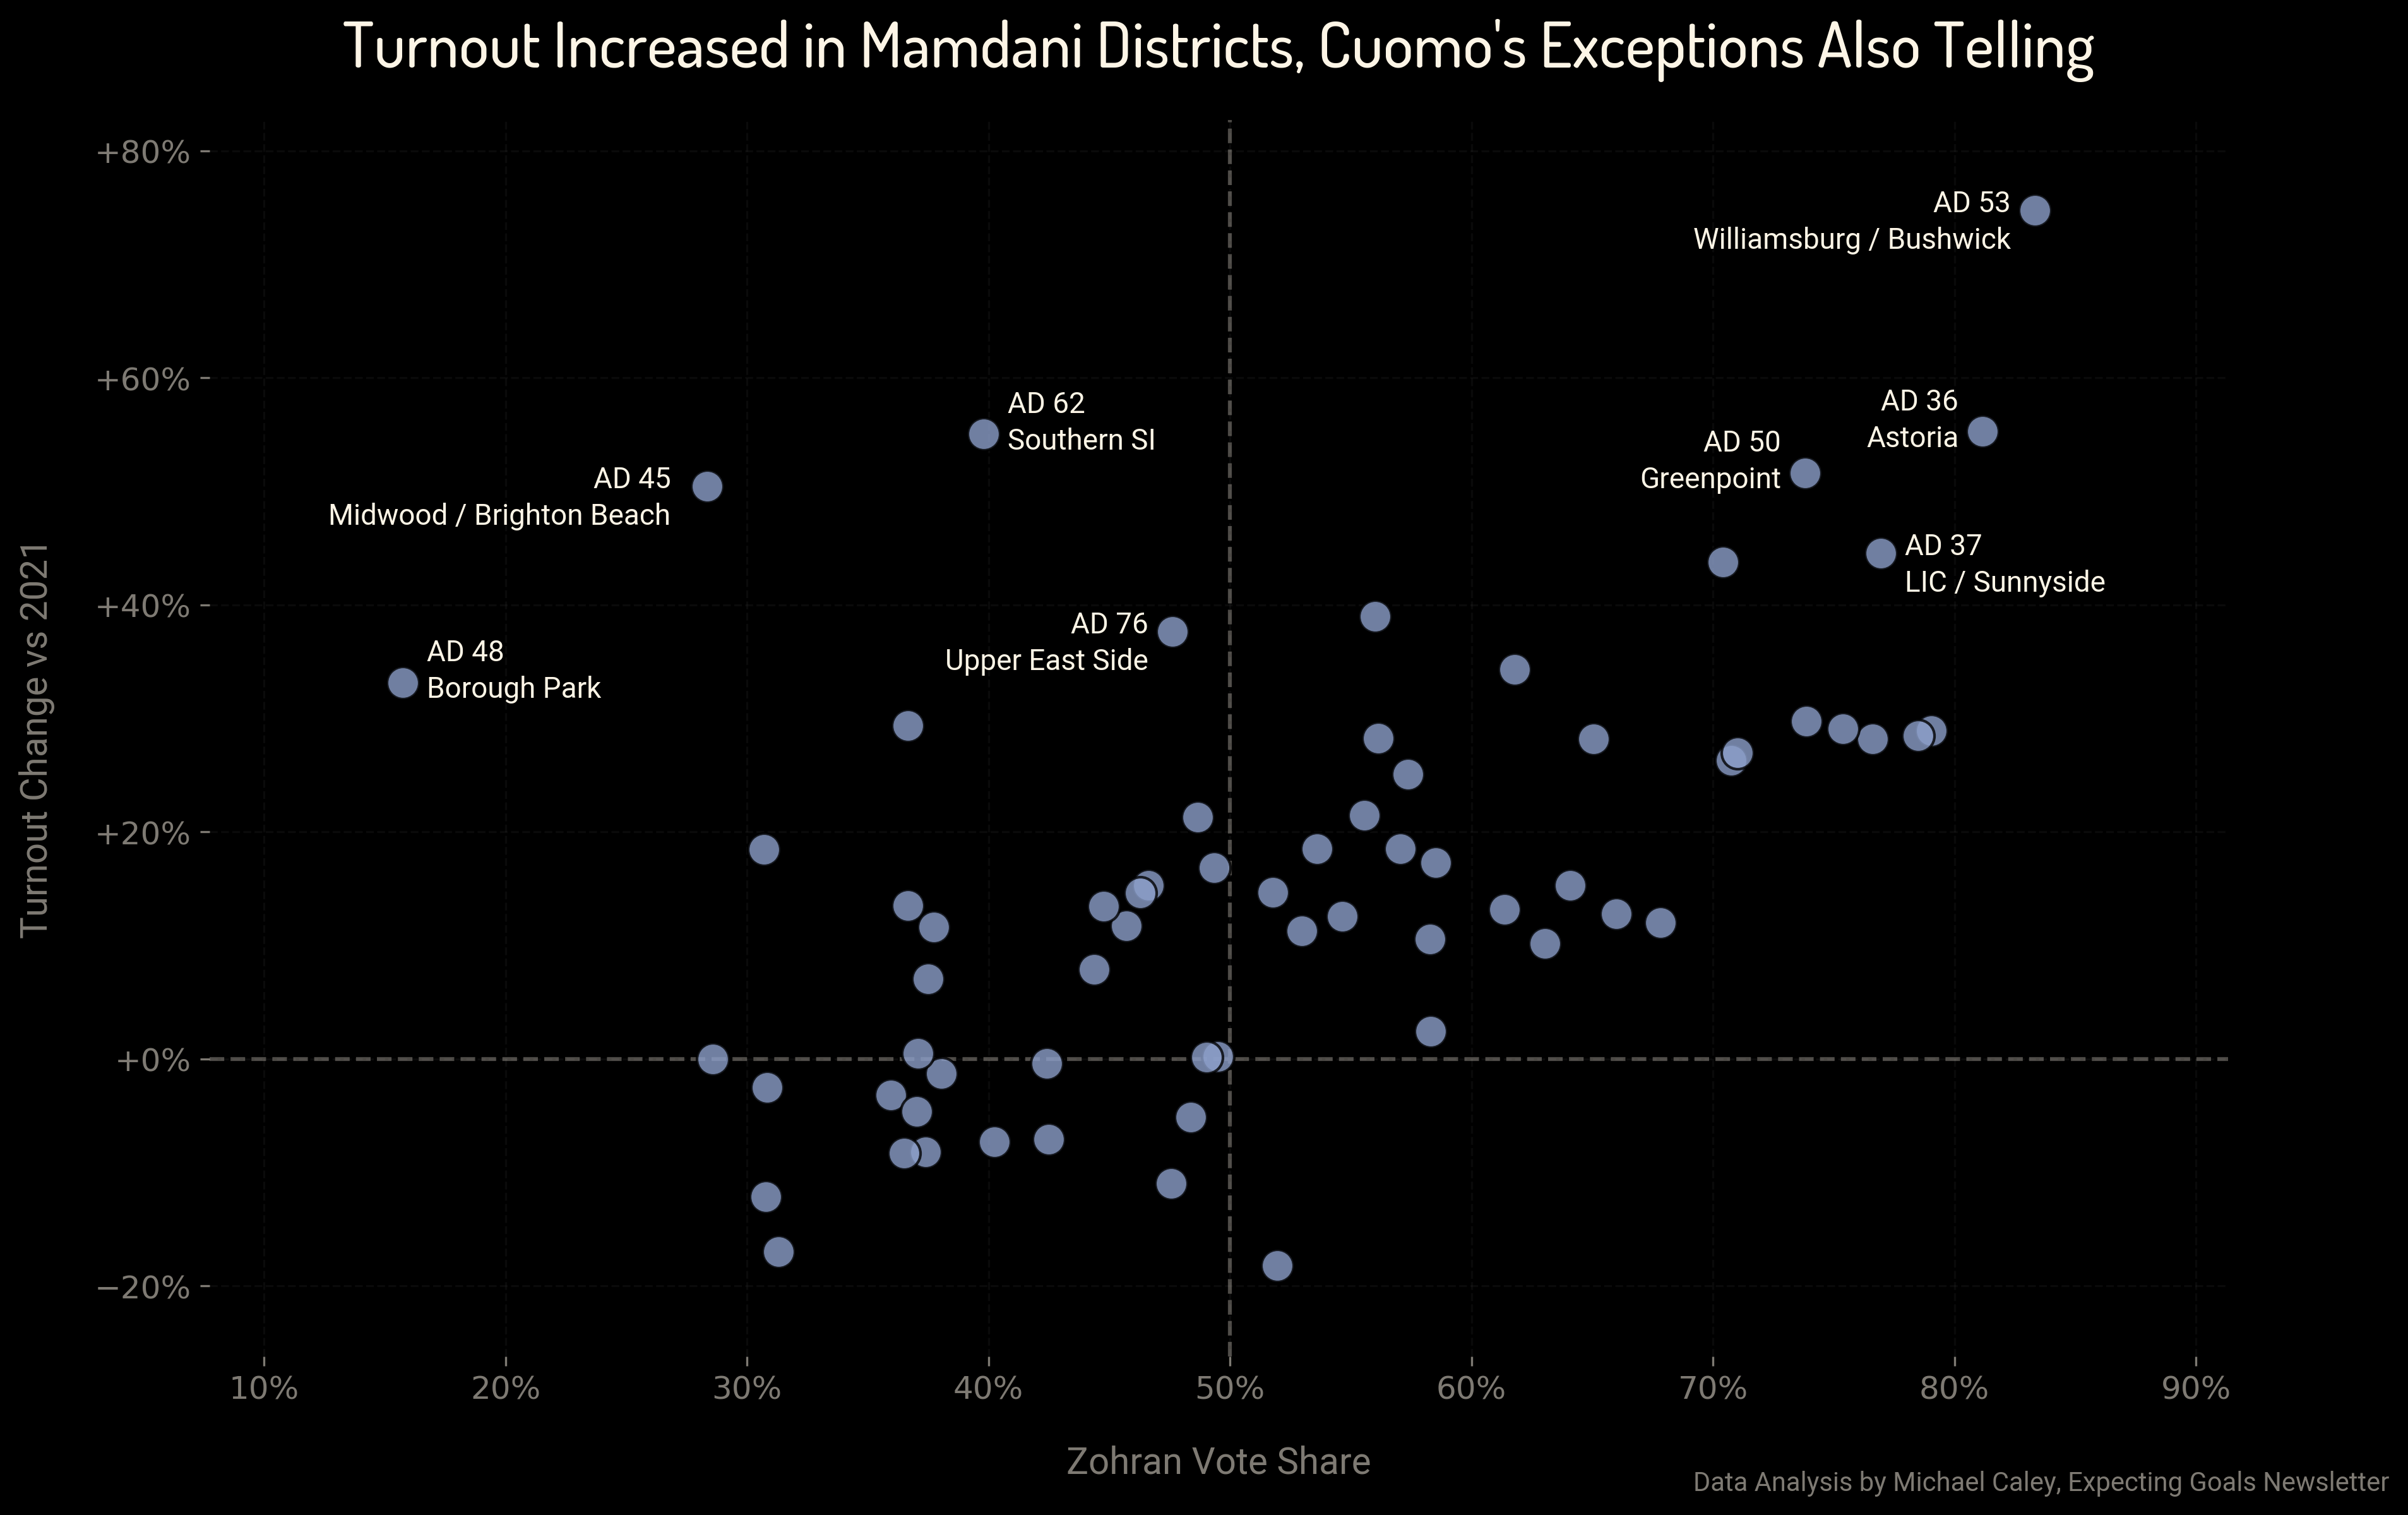
There were 14 Assembly Districts where turnout in the 2025 primary did not surpass 2021 turnout, and Cuomo won 13 of them.
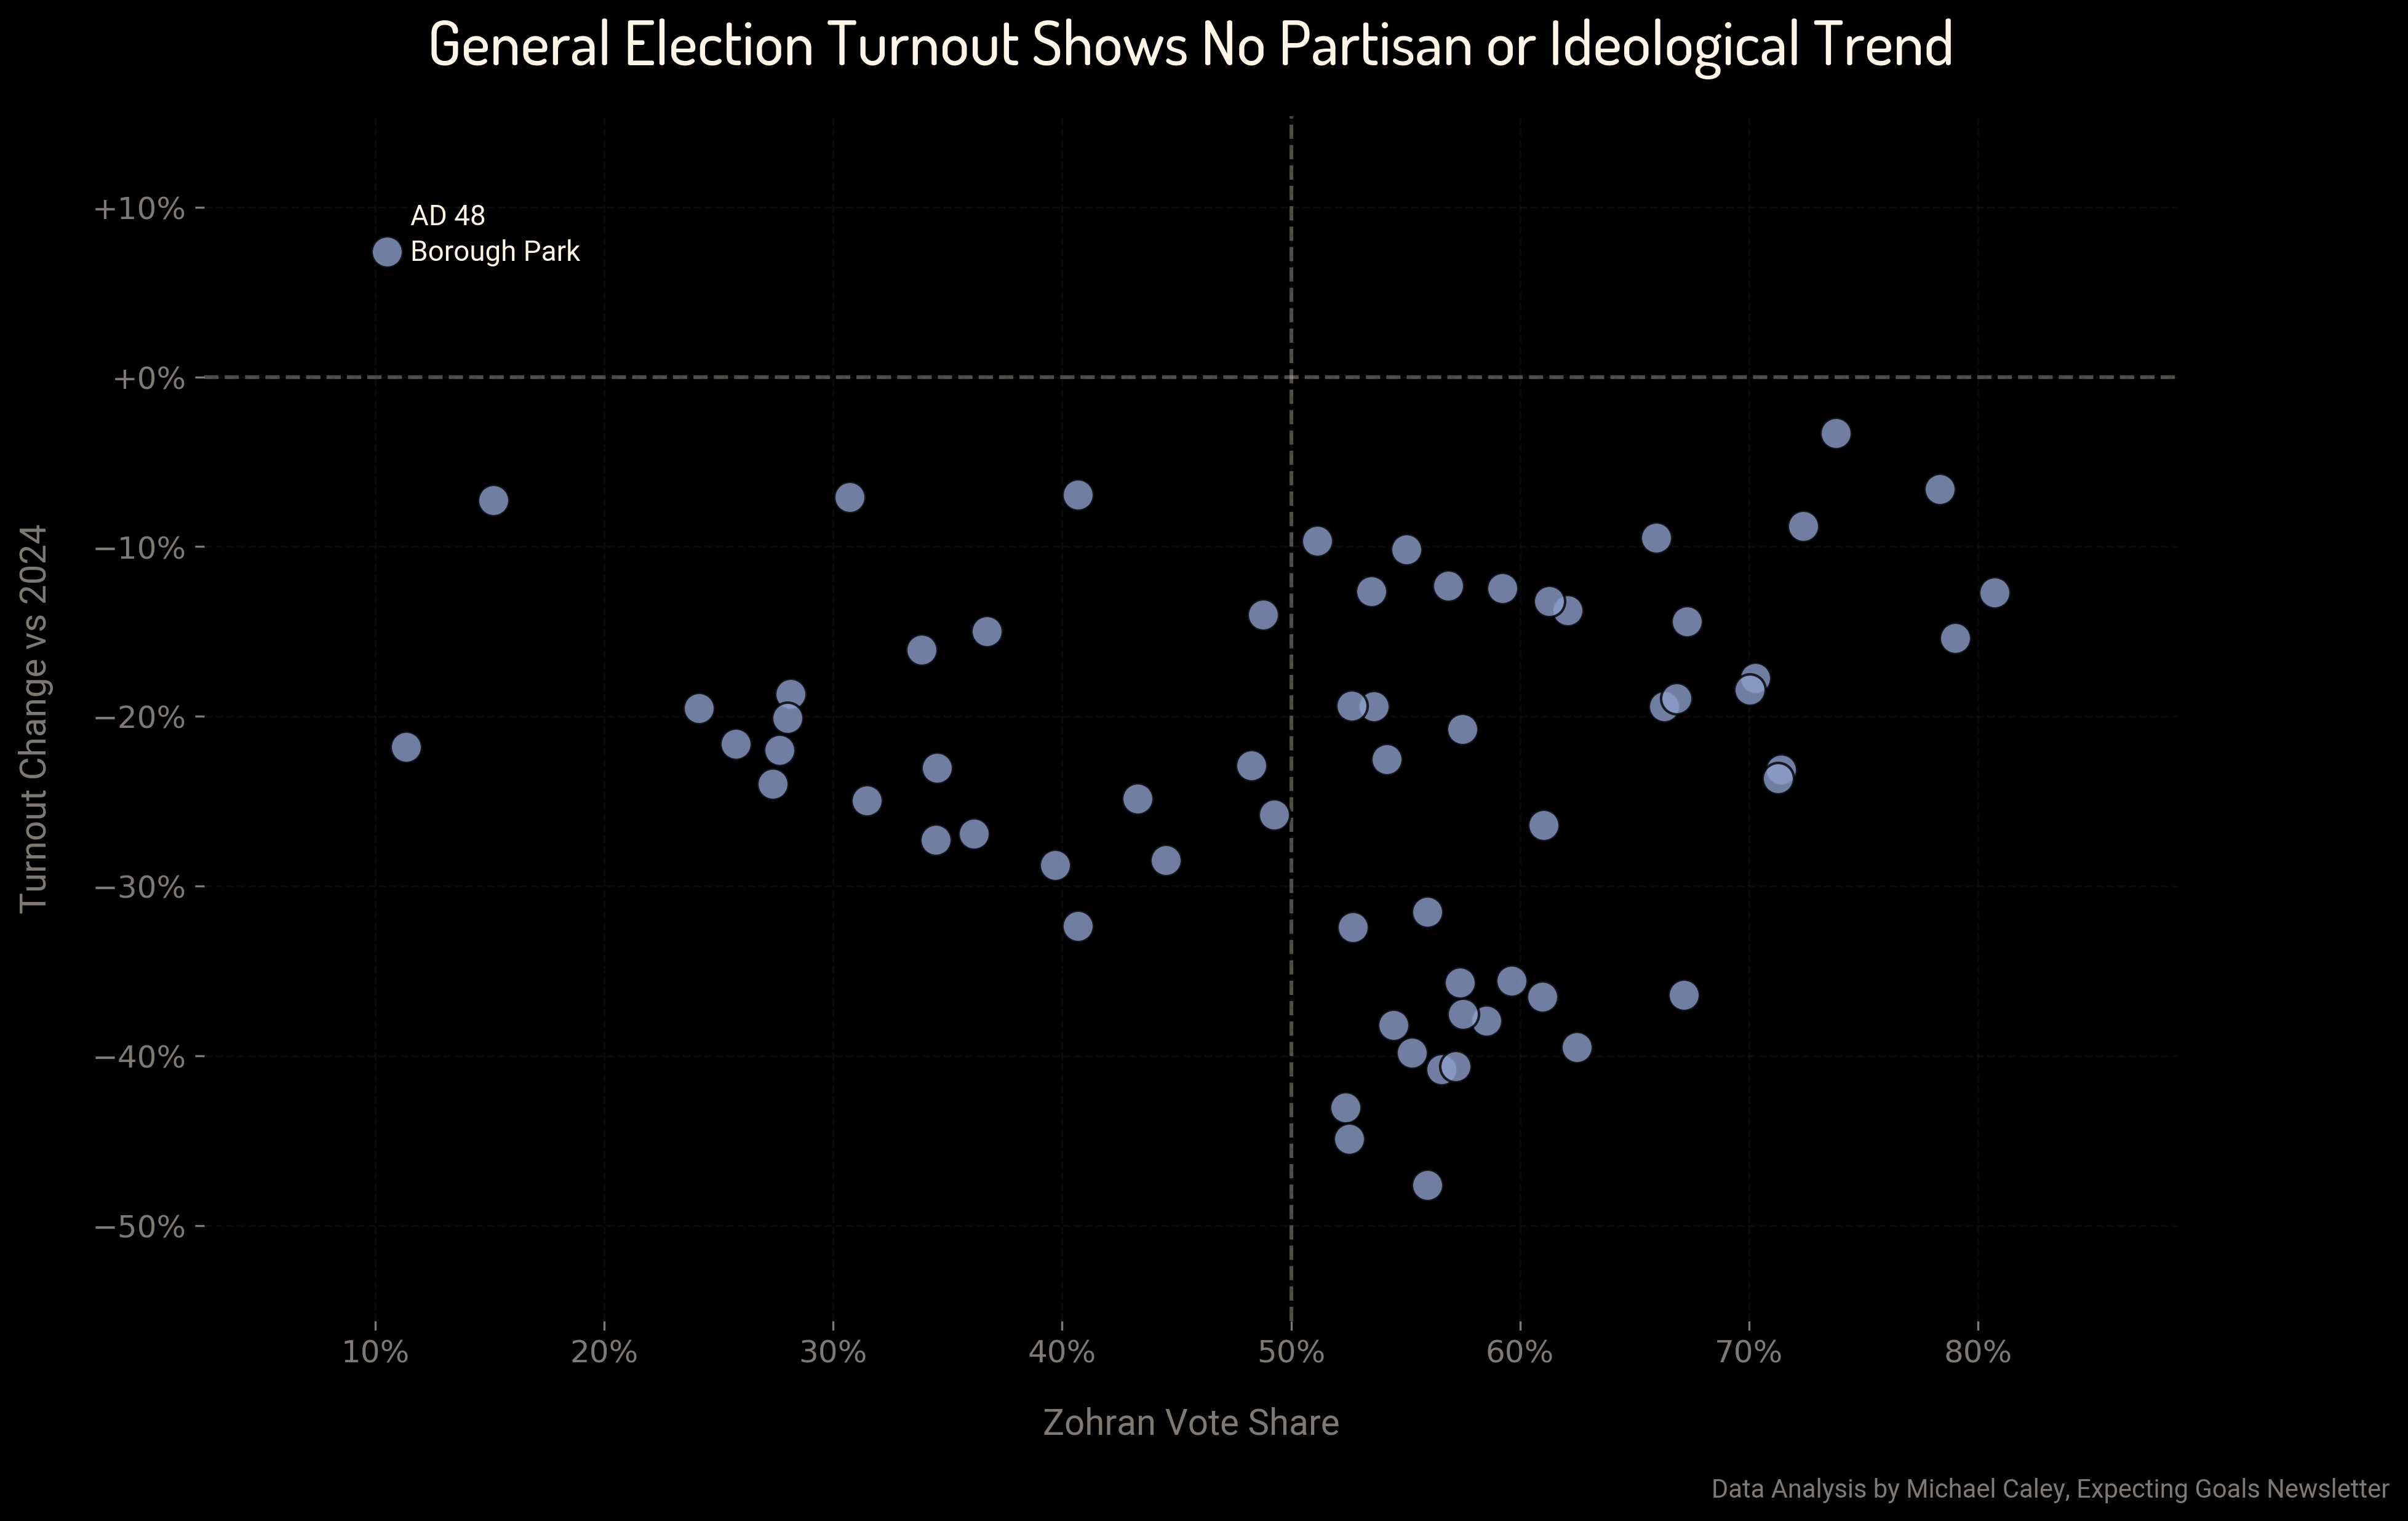
But the few districts where Cuomo did perform well in the primary and where voter turnout did increase from the 2021 baseline are perhaps just as indicative of the dynamics of this primary. AD45 and AD48 in Southern Brooklyn are home to large Haredi Jewish communities who have recently strongly supported Trump, as well as significant numbers of Republicans. AD62 in Southern Staten Island is the most consistently Republican area of the city, while AD76 in the Upper East Side is a moderate, affluent Democratic area. All four regions are heavily white. In areas where Cuomo’s support was highest among white voters, his campaign turned out supporters at good rates.
But most of Cuomo’s support did not come from affluent moderate or conservative whites. It came from black and Hispanic middle class and working class voters in Brooklyn, Queens, and the Bronx. And those are precisely the areas where voter turnout fell.
(If you are interested in the political geography of New York City, see the accompanying newsletter, “The Political Geography of New York City”.)
The core of Cuomo’s failure in the primary campaign was that his campaign, with its focus on Israel-Palestine issues and on the dangers of socialism, did successfully turn out voters in areas where these topics were pertinent. But for the working and middle class black and Hispanic voters that made up Cuomo’s real base, the campaign had little in the way of message or outreach. Further, with his median-voter focused message on affordability, Mamdani was able to reach moderate voters who may not share his larger ideology. Mamdani cut down the margins of his losses in most of his opponent’s base areas, winning on average about 40 percent of the vote there while racking up 70 percent or better numbers in his best districts. And of course Cuomo failed to drive turnout among most of his base.
Mamdani, by contrast, motivated a historic shift in primary voter turnout.

The 2025 New York City General Election: A Normal Election
While the primary was marked by an unusual voting structure and massive shifts in the voting population, the general election ended up a surprisingly normal affair. Even though Andrew Cuomo ran an independent, third-party campaign and Republican nominee Curtis Sliwa refused to step aside for him, Mamdani’s eventual winning coalition was not all that different from a typical Democrat’s coalition.
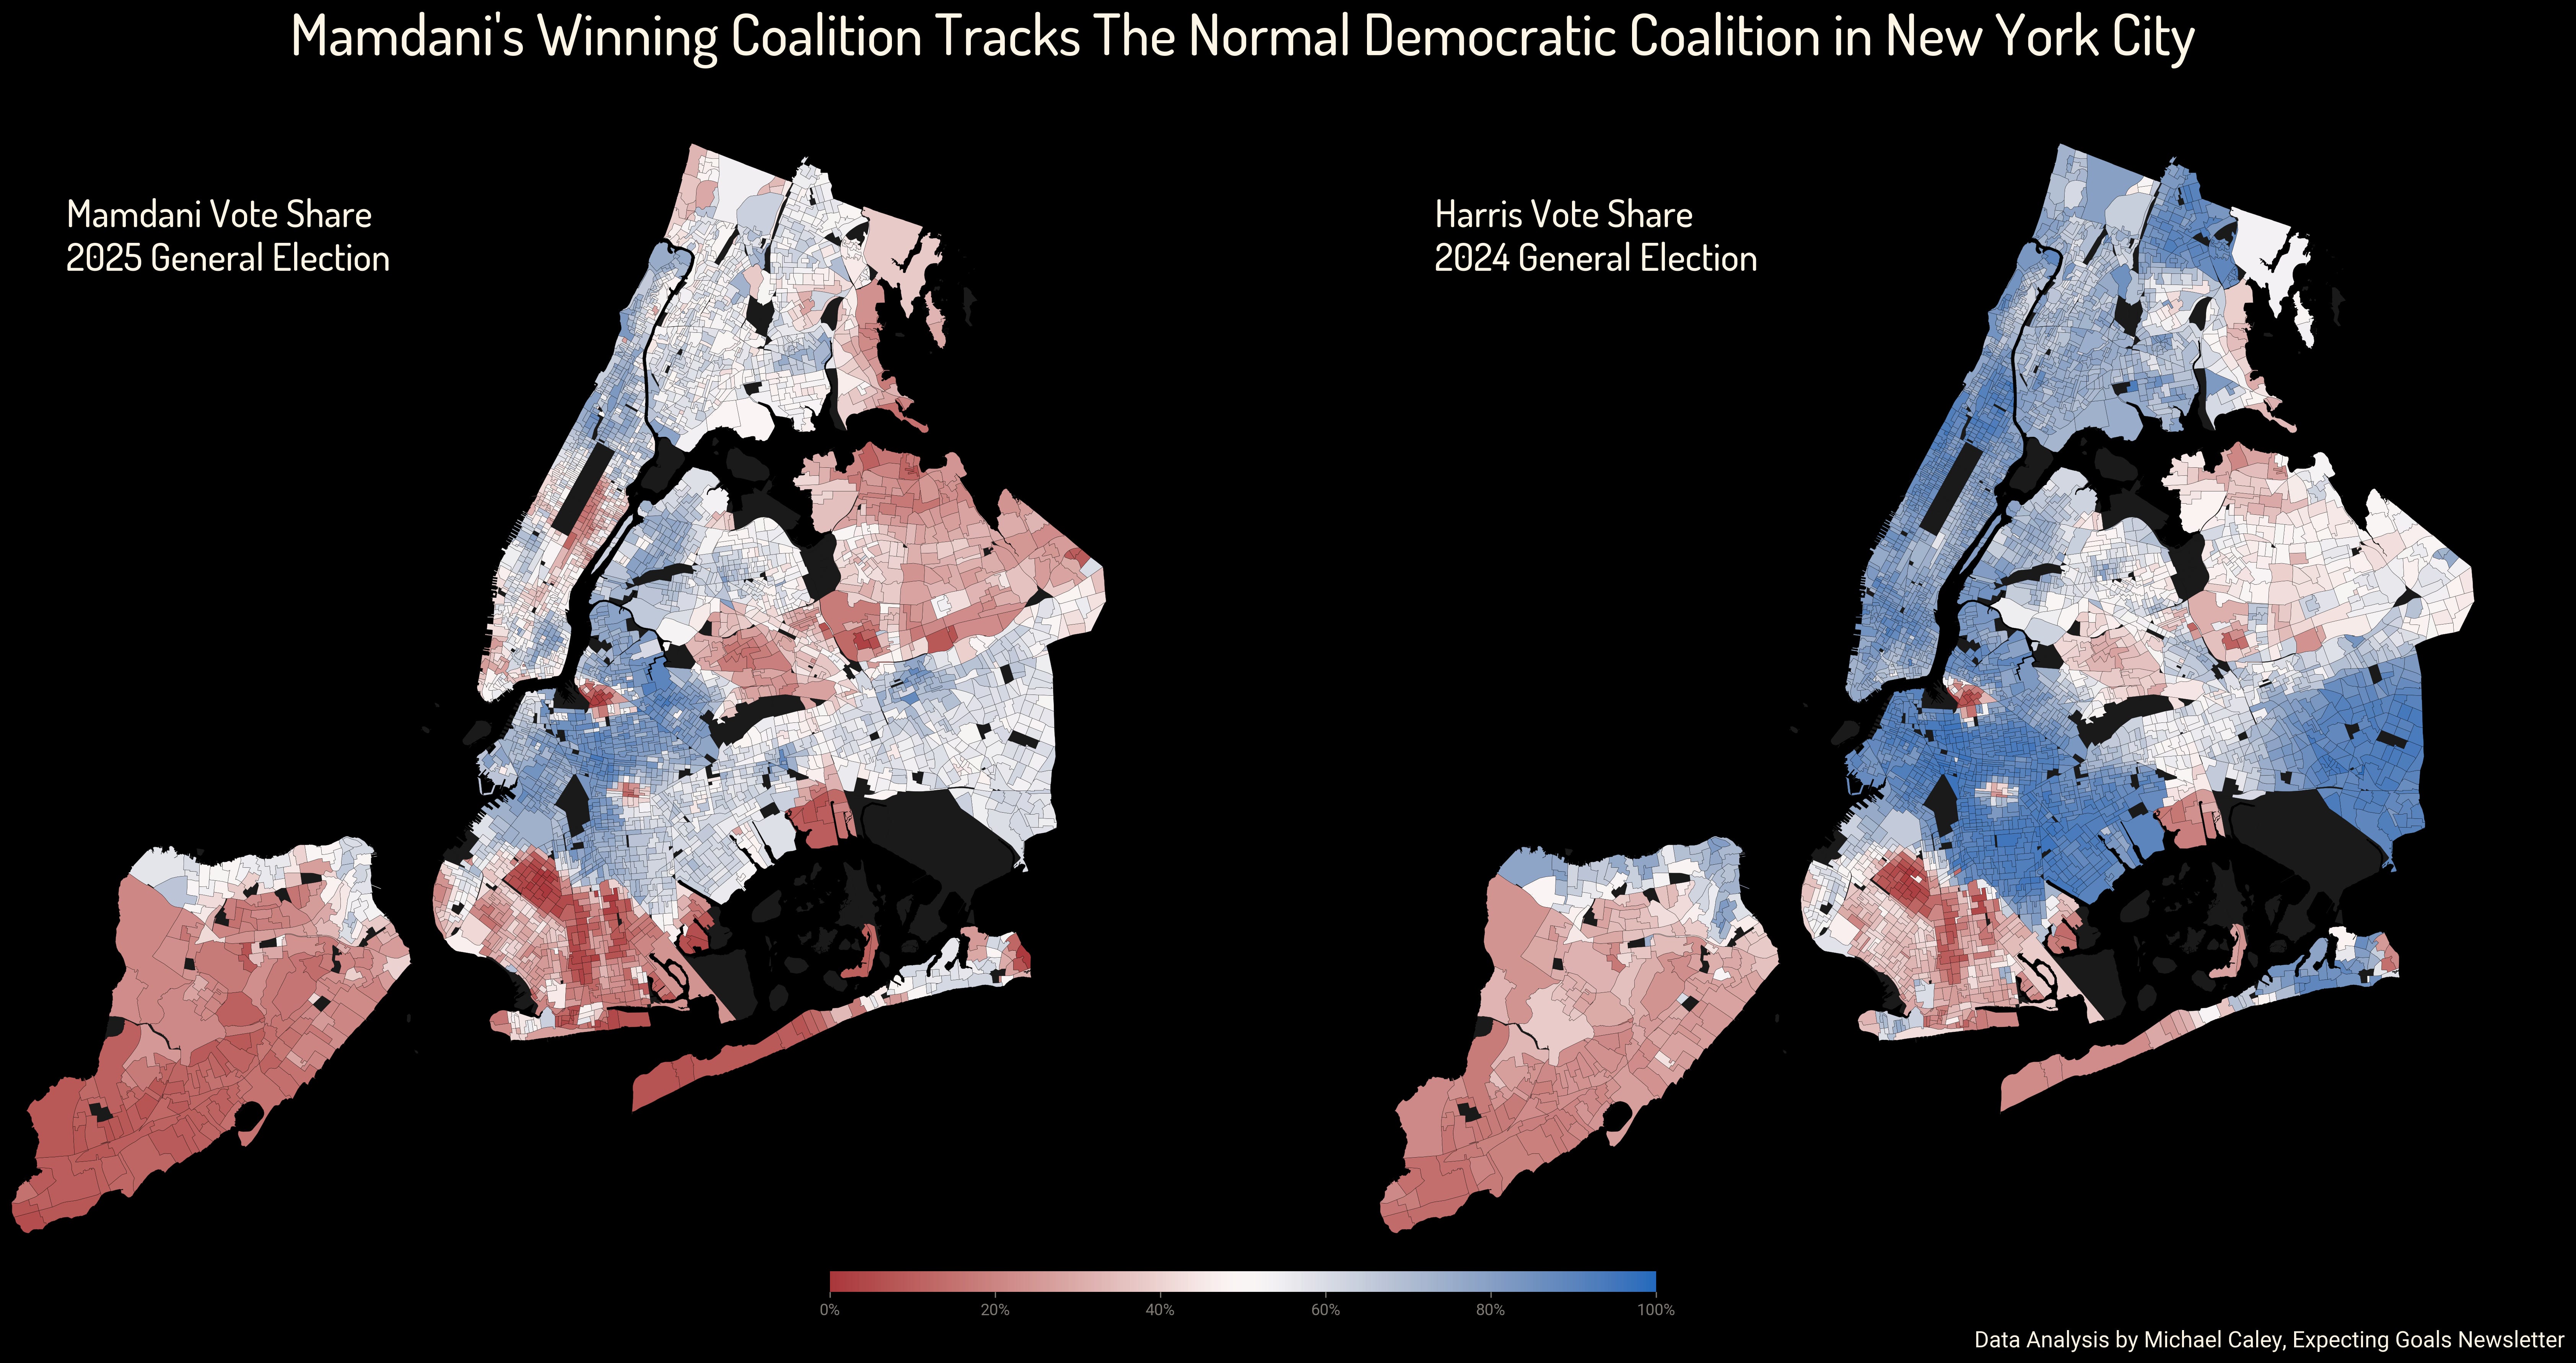
Obviously Mamdani, running in a three-way race against a former Democratic governor, ended up with a much lower overall vote share than Kamala Harris (51 percent as opposed to 68 percent). However, the shape of his support is easily recognizable. Mamdani lost Republican areas and won Democratic areas, if with lower margins in some of the Democratic areas. The only real exception is the Upper East Side of Manhattan, a Democratic area where Cuomo nonetheless notched a clear victory.
But for the most part, Mamdani won because Democrats voted for the Democratic nominee in a general election.
A map of the change in vote share from the primary shows that Mamdani gained votes in Democratic areas and lost votes in Republican areas.
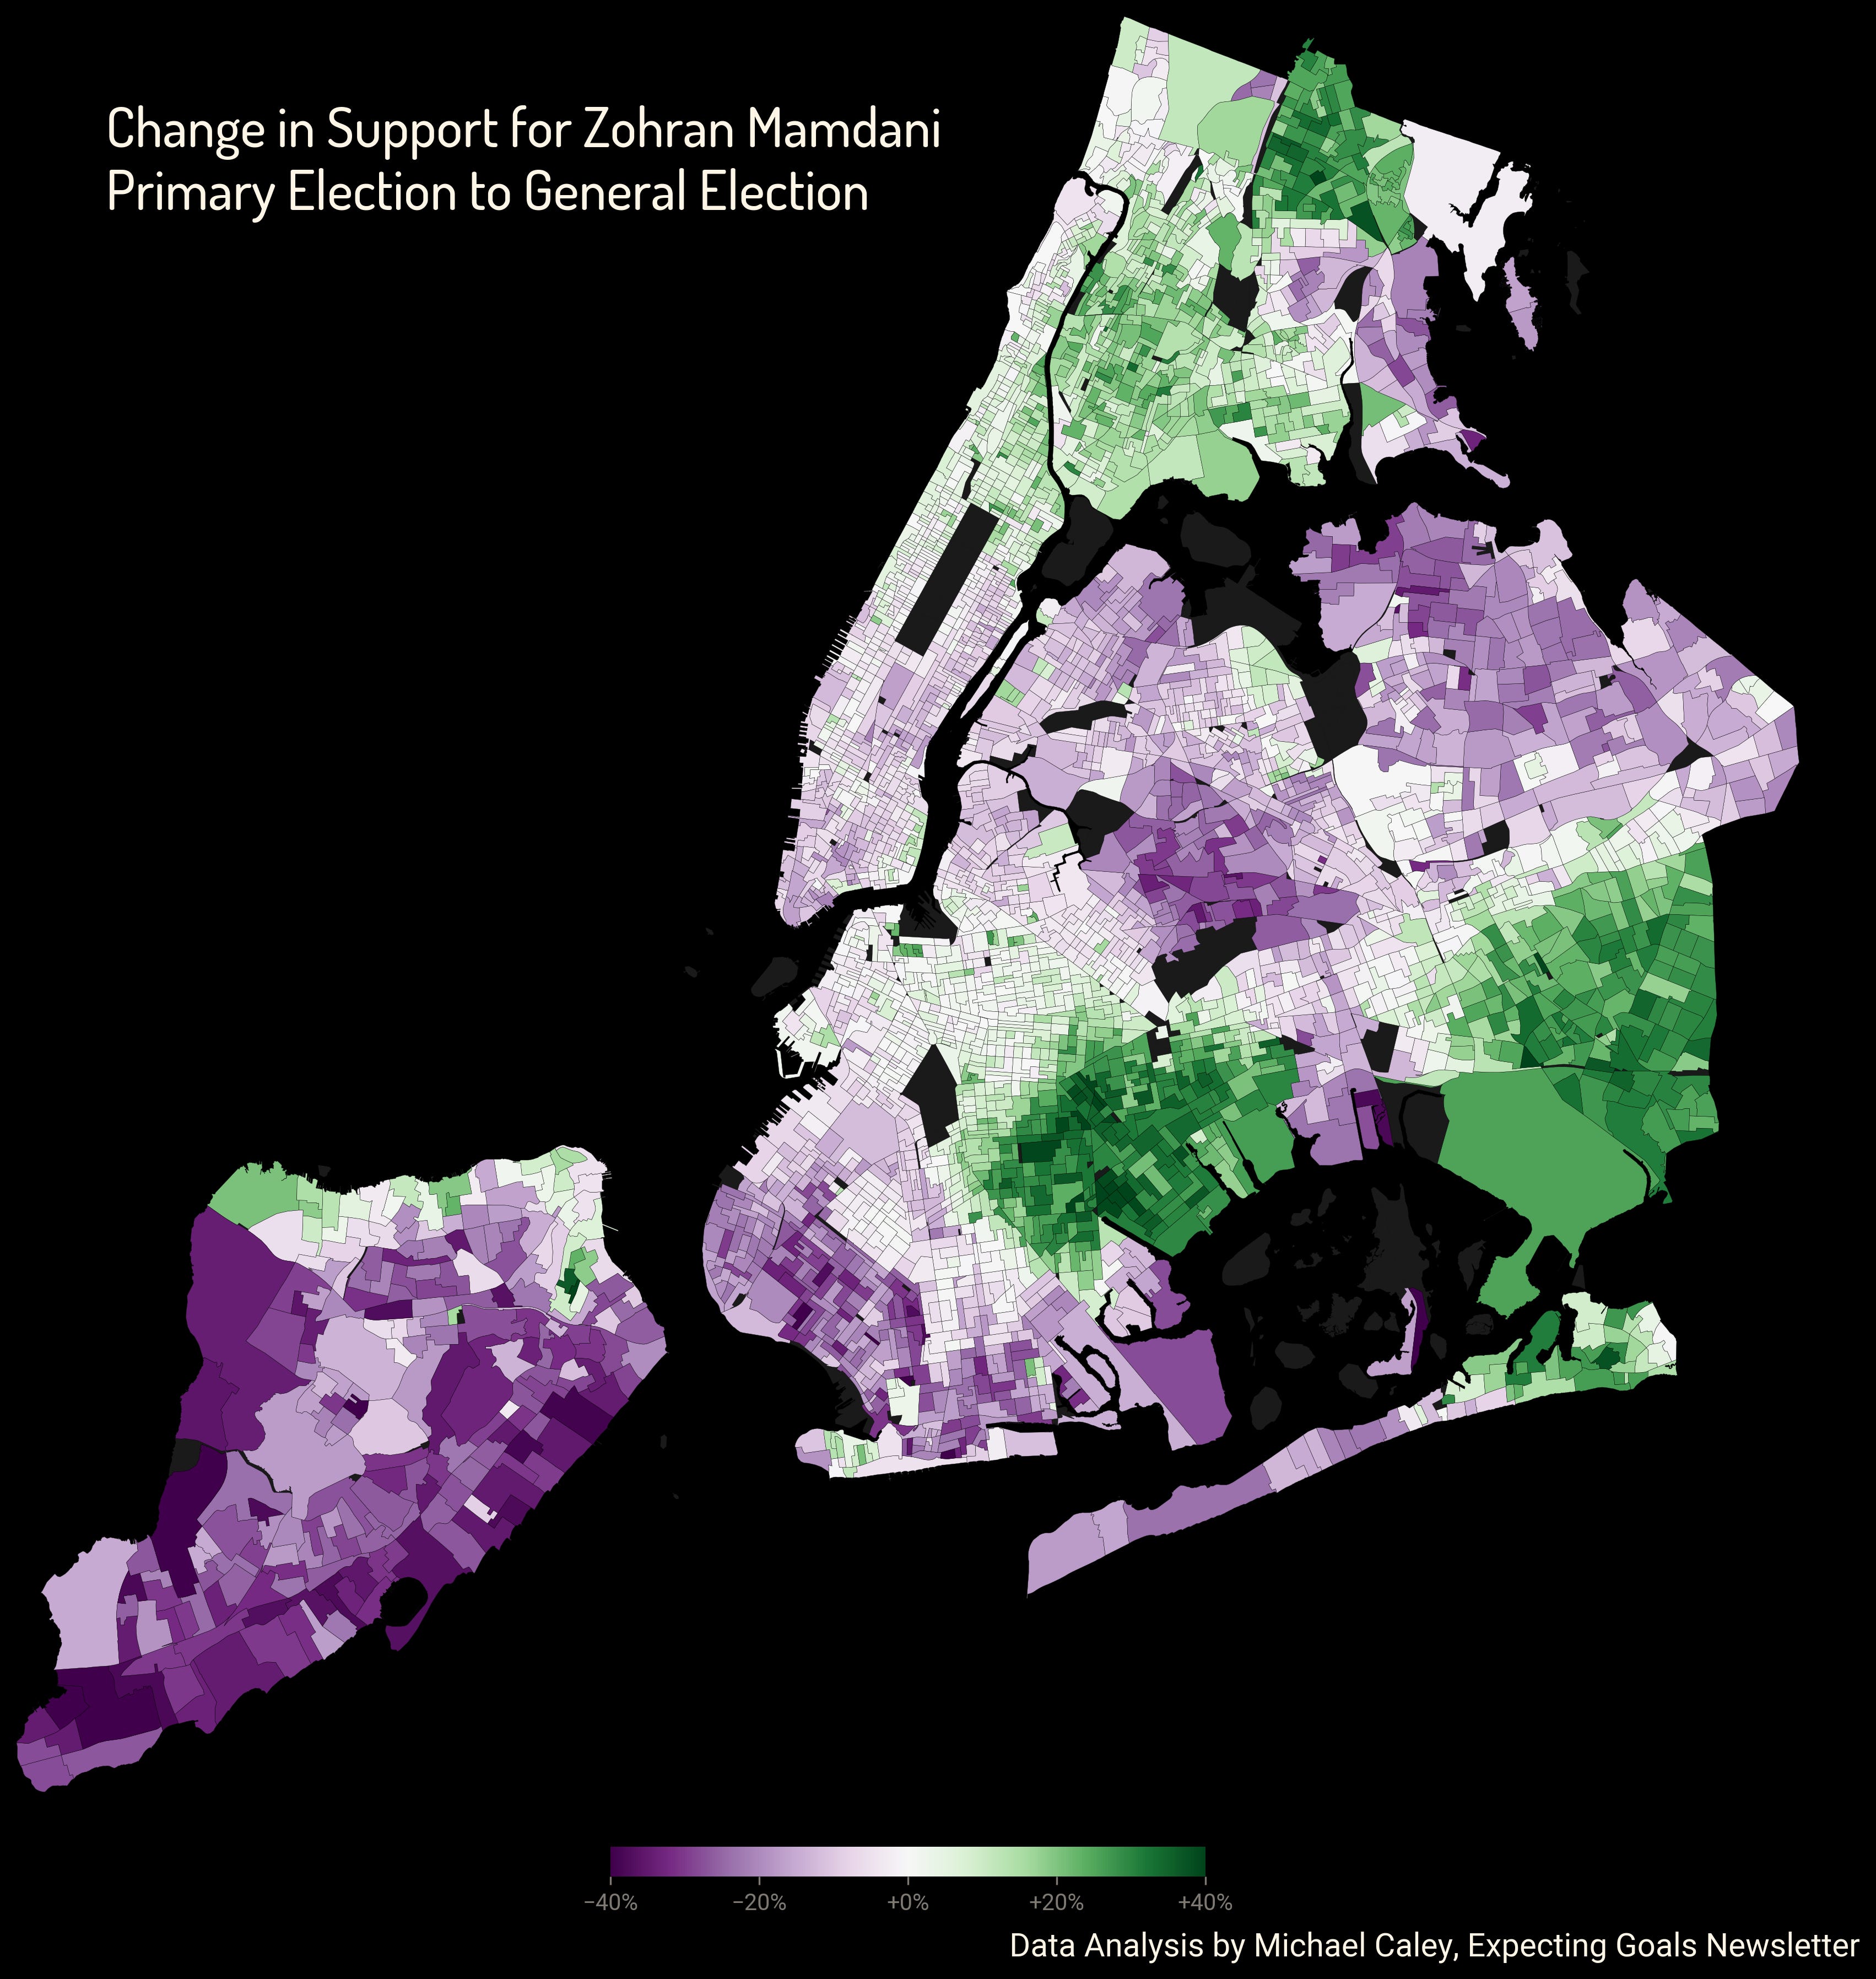
It was precisely in heavily Democratic areas of the Bronx, Southern Queens and Central to Eastern Brooklyn where Mamdani made major gains compared to the primary. Republicans turned out in force in Staten Island, Southern Brooklyn and Northern Queens to vote against Mamdani. But at the same time a critical group of Cuomo supporters from the primary, moderate and mostly black and Hispanic Democrats, flipped to back Mamdani and gave him the margin he needed.
Once again, Andrew Cuomo’s campaign, buoyed by support from Donald Trump, successfully won over many of the Republicans they were targeting. But they lost Democratic support for every Republican they won and that’s not a good trade in New York City.
It’s worth returning to the point that Republicans turned out to vote. While Mamdani had a massive turnout advantage in the primary, the November electorate showed no obvious trend either way compared to 2024.
One of my favorite little indicators of how far to the right a New York City electorate tilts is the percentage of the vote that came from Republican Staten Island, from everywhere in the borough excluding the North Shore.
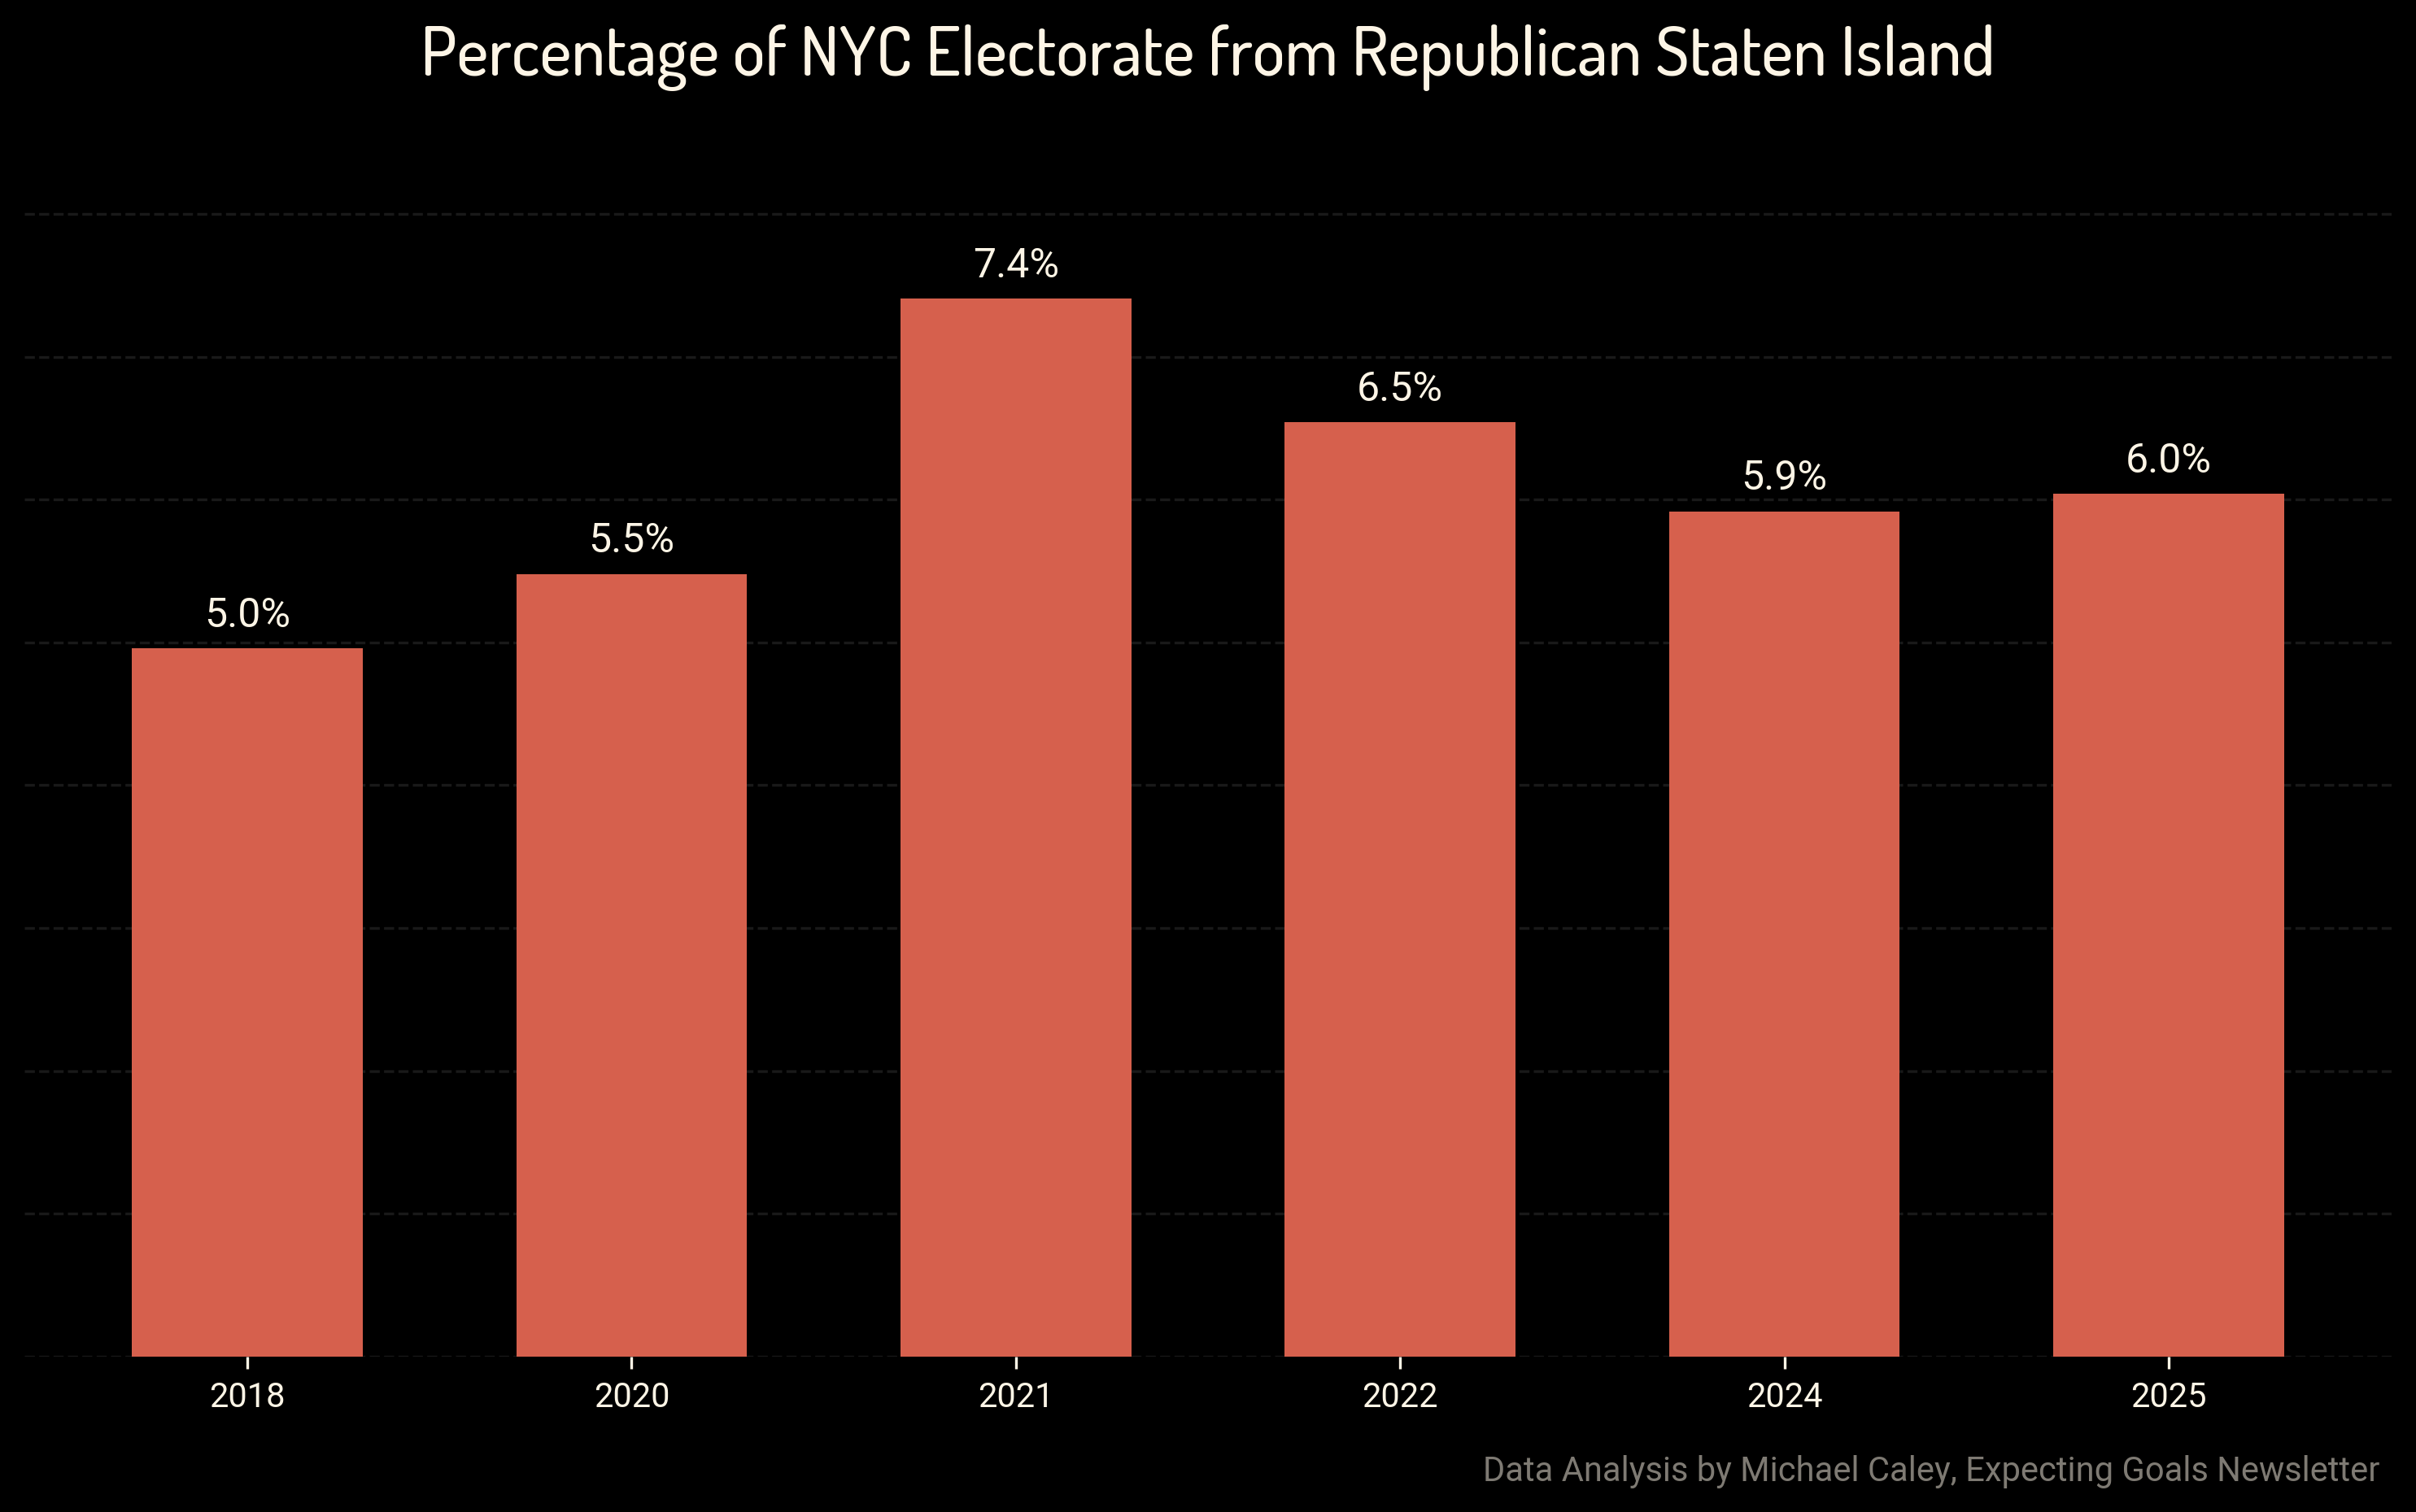
Unlike in 2018 when Democrats massively outvoted Republicans in a blue wave year, here Republicans made up a healthy slice of the electorate.
There are two big takeaways from this point. The first is that the Mamdani campaign did not discover a way to change the electorate with a new message. Instead, it seems that Republicans were unusually motivated to vote against a socialist candidate, leading to an electorate that was more balanced, or perhaps even slightly tilted to the right, compared to expectations in an off-cycle election.
Republican voters have agency, and they expressed their preferences in clear terms. Right-wing media, influential figures, and voters themselves recognized and opposed Mamdani’s ideology in particular.1 Conservatives are nowhere near a majority in New York City, and so they were outvoted. The story here is that a Democratic Socialist running on the Democratic line can absolutely win a high-stakes election in a large Democratic city, but not without facing a substantial right-wing backlash.
At the same time, even if this election result doesn’t validate a new way of winning elections for the left, it does offer a surprisingly representative view of the electorate right now. A “normal” election in an off cycle year doesn’t come along very often, and this is an opportunity for deeper analysis.
A Normal Election is a Representative Election
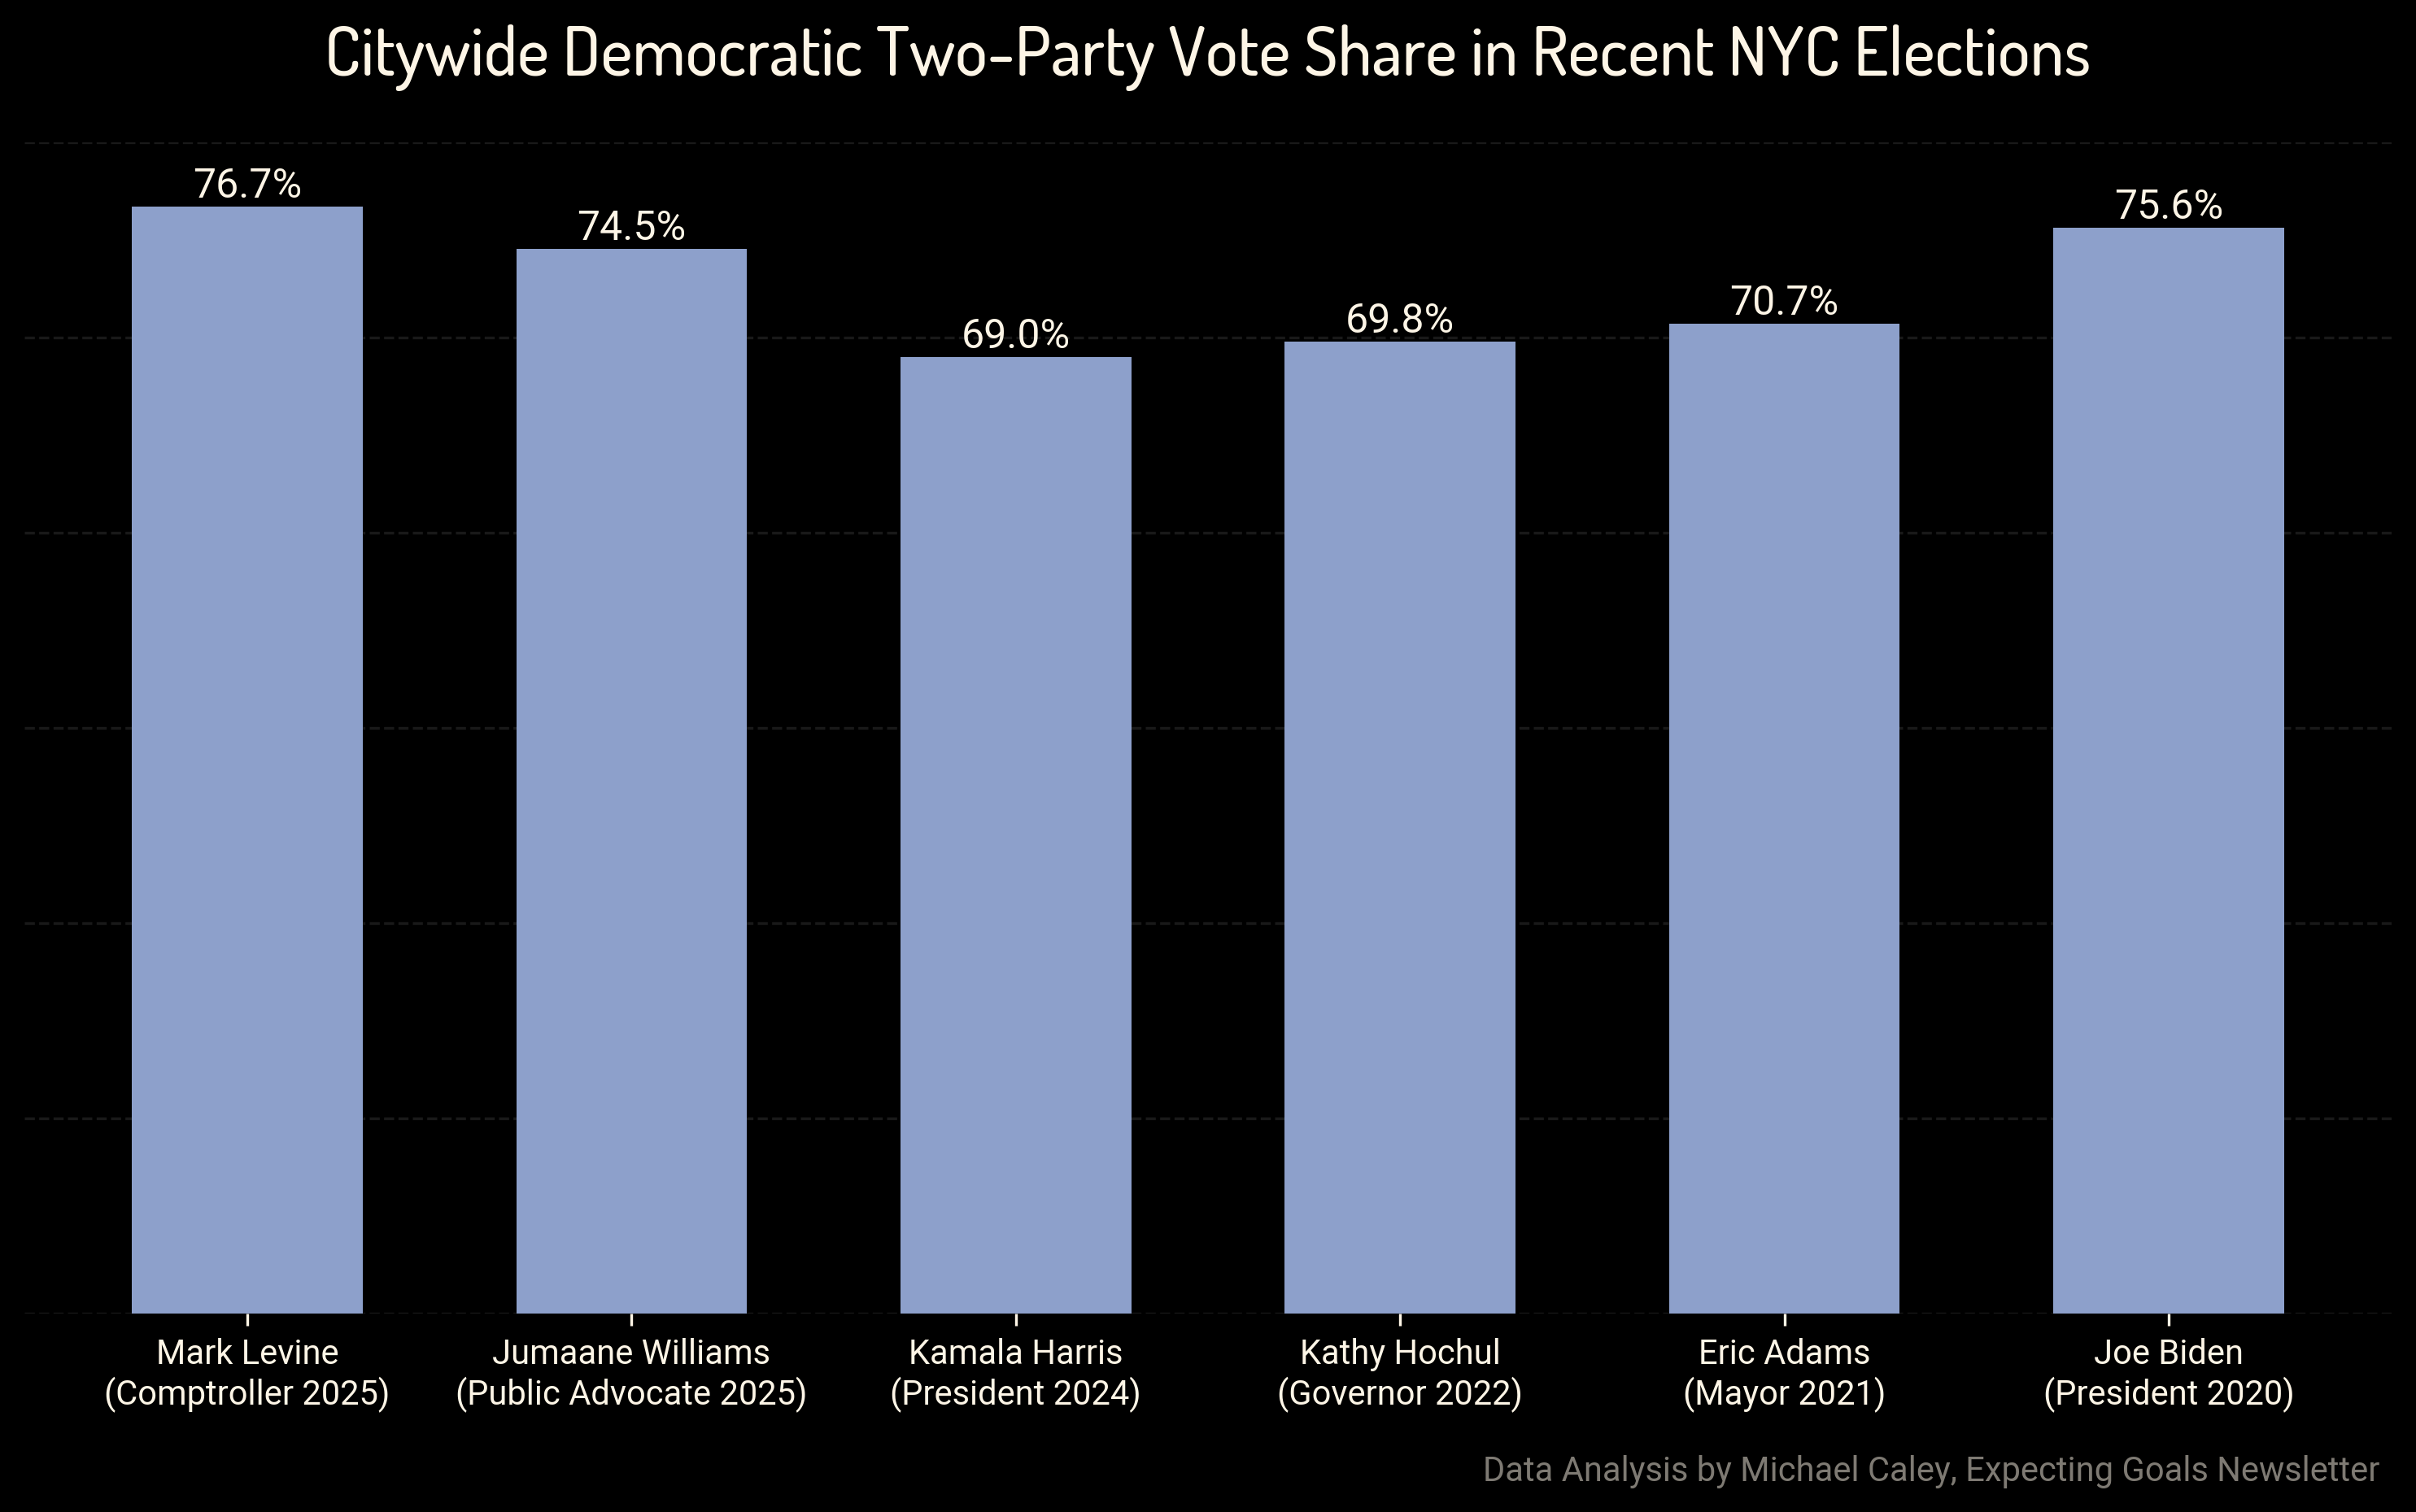
The problem with drawing any conclusions from the November election is that the Mayoral contest itself can’t offer any particular insights because it was a three-way race. But there were two citywide elections, for Comptroller and Public Advocate, contested between Democrats and Republicans, appearing on the same ballot.
Mark Levine won the two-party vote for Comptroller by a 77–23 margin, and Jumaane Williams won the two-party vote for Public Advocate 75–25. These were the best citywide candidate numbers since 2020. (Chuck Schumer managed 74–26 in his Senate re-election in 2022, that’s the closest one.)
These were down-ballot candidates, where odd things can happen. However, it is worth noting that in the 2021 citywide election, the Public Advocate and Comptroller candidates (Williams and Brad Lander) ran only one or two points ahead of Adams.
Further, there were some tightly-contested City Council races in New York City this cycle which offer a more granular view of voter shifts. In particular, Council District 30 in Central Queens and Council District 47 in Southern Brooklyn had open seat elections, which means they were unaffected by incumbency effects. Both were tightly contested, as Republicans had made major gains in these areas since 2020. The Democratic candidates, Kayla Santosuosso in CD47 and Phil Wong in CD30, won by double digits. Levine and Williams put up similar numbers.
It is important to note that it was Democrats in two-ways contests who ran strongly here, not Zohran Mamdani. Cuomo won both CD30 and CD47, by three and five points respectively. What the down-ballot races show us is that while Mamdani gained most of his votes from Democrats and liberals, there was a crucial slice of voters who chose Cuomo while voting Democratic down-ballot. These swing areas of New York City have swung back, but the candidates who can win here need to win over a significant minority of Cuomo voters.

The down-ballot races all seem to confirm that, beneath the three-way Mayoral election, Democrats had an extremely strong election in New York City. With an electorate probably more conservative than the 2024 electorate, Democrats outperformed Harris’ baseline by something in the range of six to eight points, and by more in these swing council districts.
As I have previously written, New York City was a bellwether for the nation in the Biden years. The collapse of support for Democratic candidates in 2021 and 2022 in New York City ended up being a preview for the nationwide Democratic losses in 2024. The concentration of losses among non-white voters, particularly among Hispanic and Asian voters, as well as white people without college degrees, was a notable feature of weak runs by Eric Adams and Kathy Hochul in 2021 and 2022, and then a nationwide problem for Democrats in 2024.
While Harris trailed Biden’s support level by 6.6 points citywide, she fell about 8-9 points in Council Districts 30 and 47. And CD30 and CD47 are not among the places where Harris lost the most votes from Biden. Nonetheless, they are representative of the shift away from Democrats in 2024.

(CD47 spans most of the Southern Brooklyn waterfront while CD30 is a relatively conservative area of Central Queens.)
So this raises a question. If Democrats gained back ground unusually in two council districts which had shifted right, were Democratic gains in 2025 concentrated in precisely those areas?
A comparison of Levine’s and Williams’ vote shares with Kamala Harris’ from 2024 and Joe Biden’s from 2020 shows that this appears to be the case.

Levine and Williams saw only modest improvements over Harris among the white conservative voters of Southern Staten Island, Northeastern Queens, and Rockaway Beach / Breezy Point. But across more heavily Asian and Hispanic areas of Northern and Central Queens, the Bronx and Southern Brooklyn, their gains almost perfectly mirror Harris’ losses.
This map does not quite look like 2021 to 2024 never happened, but it is close.
The 2025 election in New York City shows a massive swing back toward Democrats in a city which had been the epicenter of Democratic losses over the last several years. This swing back did not happen because of differential turnout, despite 2025 being an off-cycle election, because Zohran Mamdani motivated conservatives to turn out to vote. It looks like somewhere between six to eight percent of voters simply changed their minds about Republicans.
The Exceptions: Upscale Manhattan and the Haredi Vote
We see massive gains for Mark Levine, and some for Jumaane Williams, in areas of Southern Brooklyn, South Williamsburg, Central Queens and Far Rockaway which are home to large Haredi Jewish communities. The vote in Haredi areas tends to move more like a bloc, with influential rabbis able to activate large majorities with their endorsements, and often happy to swing back and forth between Democrats and Republicans in local elections to ensure funding and support. The fact that Levine, and to a lesser degree Williams, were able to sway Haredi votes is a specific local dynamic best treated as an outlier.
To account for this, and to describe the political geography of New York City more clearly, I built a “Gaussian Mixture Model” based on electoral and census data to categorize the political regions of New York City. (See the companion newsletter on the political geography of New York City for a full discussion of these model results and what they can tell us about the city.)
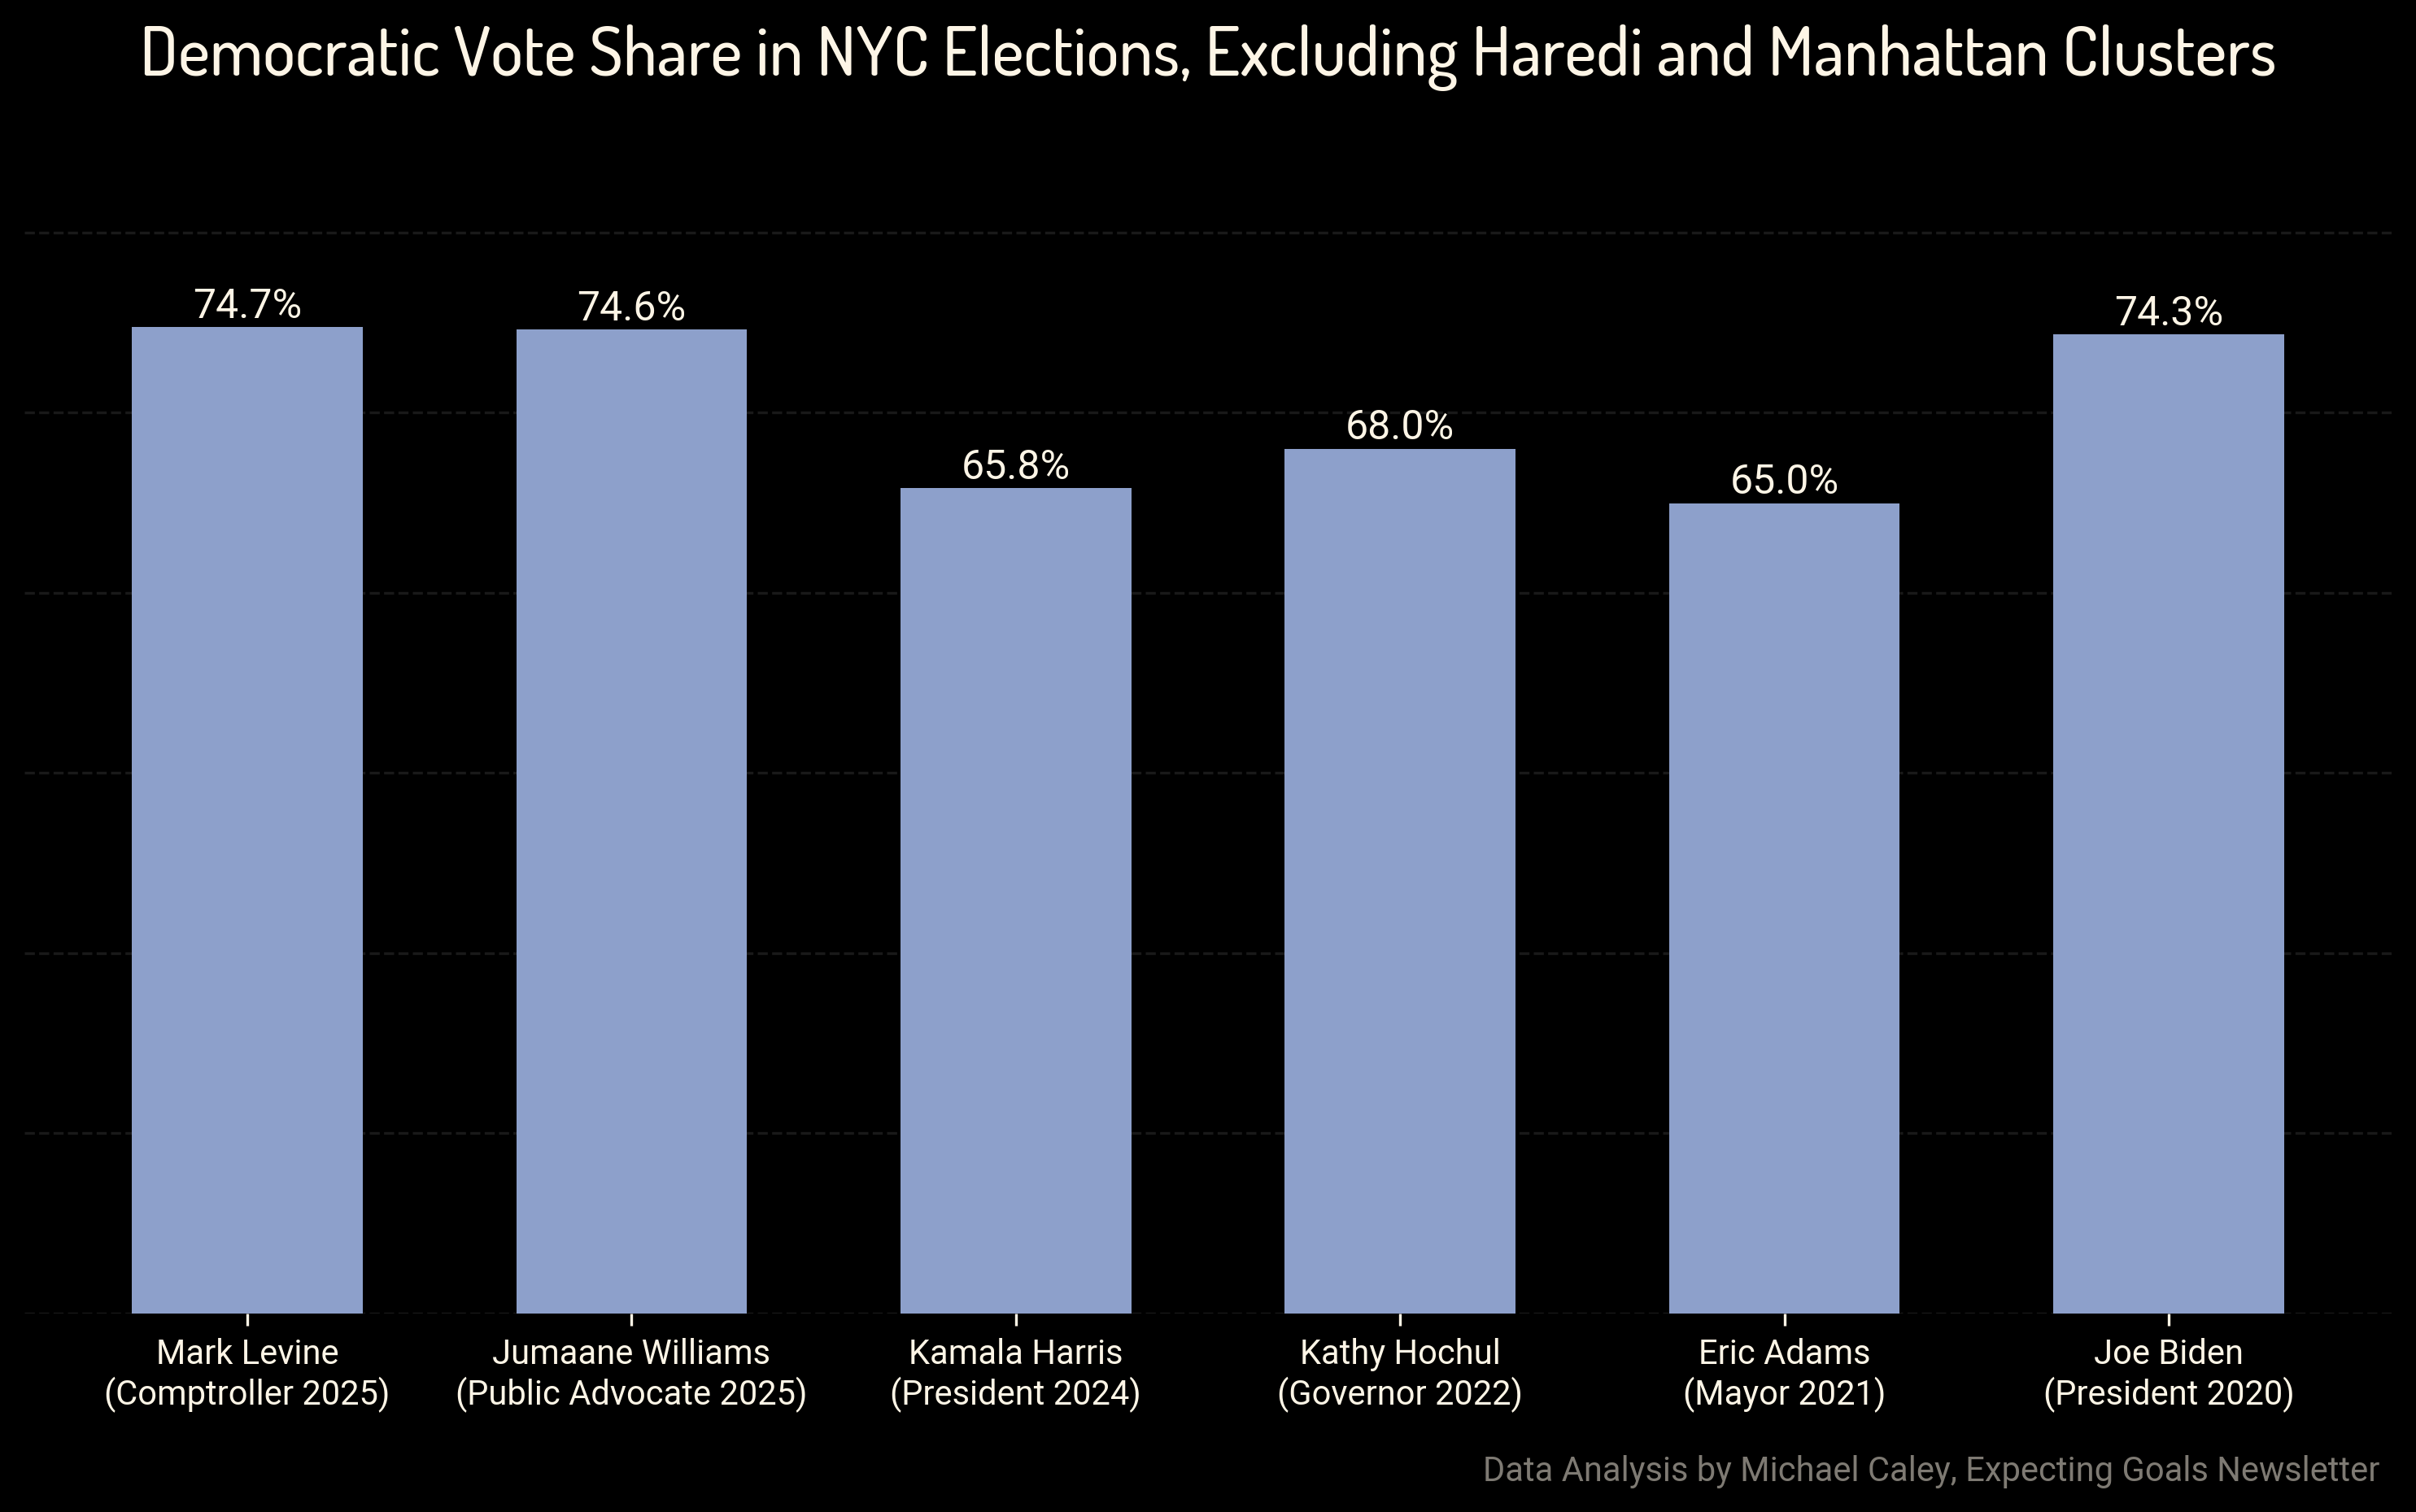
One thing that came out very clearly from this analysis was the distinct political behavior and demographic qualities of Haredi districts. If we exclude the districts in this cluster, Levine and Williams end up almost exactly even, at 75 percent, Harris is unchanged at 69 percent and Biden jumps up slightly to 77 percent.
But there’s another clear outlier on the map. The swath of Manhattan from Battery Park and Tribeca on the lower west of Manhattan, up through midtown and both the Upper West Side and Upper East Side bordering Central Park, shows a notable trend against Democrats. This was also a region where Cuomo ran unusually strong in the general election. My model found a large cluster that maps directly to these districts: heavily Democratic, well-educated, extremely high-income, mostly white areas where Zohran had limited primary support. The cluster model also identified Riverdale in the Bronx as having similar dynamics.
In these areas Levine and Williams lost about 5 points of support compared to Harris, unlike in the rest of the city where they made large gains.
So what is going on here? I am torn between two possible explanations. To what degree did affluent white voters in Manhattan, who opposed a Mamdani mayoralty, vote Republican down-ballot in the hopes of balancing out Mamdani rather than because they have changed their political leanings? And to what degree have a minority of Manhattan Democrats reacted to the politics of 2025 by turning to the Republican Party?
If we exclude the Manhattan cluster from analysis as well, the graph looks pleasingly symmetrical.
My guess is that this is not quite right, and Democrats really have lost some percentage of Manhattan voters in the welter of 2025. It is easy to imagine the story of moderate Democratic voters, many of them Jewish, who were negatively polarized against the pro-Palestinian protest movement and then against a socialist candidate for Mayor. But even if that is what happened, will these voters continue voting Republican after 2025? I would guess there are a fair number who will swing back in elections where state and federal, rather than local offices are up for a vote.
Further, for the question of what New York City says about the country, is this then a story peculiar to New York City, a story of voters activated by the Columbia protests and the backlash to the Mamdani campaign?
If the goal is to interpret what New York City says about the rest of the country, we should not lean too heavily on the peculiar dynamics of Manhattan. I think here we have a situation where dynamics truly peculiar to New York City have been the primary driver of election results, and this is less likely to be representative of the nation as a whole.
And in that case, this data reflects a city where Republicans had been gaining ground steadily for years, in ways that were representative of movements in the nation as a whole, and where in a high-turnout election with a representative electorate, Democrats gained seven to nine points above their previous level. That is a very large shift and it was probably primarily a matter of voters changing their minds about whether voting for Republicans is a good idea.
The National Context
In a week where Democrats saw a 13-point overperformance in a special election in Tennessee with nearly midterm-level turnout, this analysis can be added to the growing evidence of a blue wave collected by G. Elliott Morris at Strength in Numbers. Further, the specific shape of Democratic gains in New York City matches with the national trend.
Nate Cohn at the New York Times identified in the special election results from Virginia and in particular from New Jersey evidence that Democratic gains were likely driven as much by persuasion as turnout. Both exit polling and voter registration data suggest that the electorate was, while Democratic-leaning, not so blue that it could account for most of the Democratic wins on the night.
Further, some of the biggest changes from 2024 occurred in North Jersey counties, many heavily Hispanic, which had flipped to Trump in 2024. An analysis by the polling expert Mary Radcliffe found that Trump’s approval rating has been dropping fastest among precisely the groups Trump won over in 2024: younger voters and Hispanic voters. The polling is not granular enough to identify shifts among Asian voters, particularly Asian voters without a college degree, which are so striking in the New York City data. But it would make sense that yet another group of voters who tried out voting Republican in 2024 have decided perhaps it was not for them.
Election Day 2026 is still far off, and as always there is no more powerful driver of political outcomes than Events. But the signal from the 2025 data is becoming undeniable. New York City offers some of the strongest proof yet of a building blue wave. Precisely because Mamdani’s candidacy activated conservative opposition and generated a highly representative electorate, the down-ballot results from this election offer an unusually clear picture of former Trump voters, numbering perhaps seven to nine percent of the electorate, actively changing their minds.
Progressives will often say that it doesn’t matter whether you call yourself a socialist because your Republican opponent will do that anyway. The results from New York City suggest that Republican voters can tell the difference.