What Happened in the 2024 Election?
With a focus on New York City. As I have said, this newsletter can be many things.
Every year after the election, I give a talk at the New Kings Democrats general meeting about what just happened. I try to pull together the best data available to begin to tell the story of the election nationwide. Then, as NKD is a local club based in Brooklyn, I use this nationwide narrative as the context to explain what just happened in local elections in the borough and around the city.
In this newsletter, I want to expand the scope of this task a little bit.1 I want to do the descriptive work of explaining what happened in the election, but I also want to use this data to intervene in a few discussions that have circulated in left, progressive, and moderate Democratic discourse since November 5th. These are, in a quick sketch, the interventions I hope to make.
Claims that the 2024 election was driven by “turnout” or by “persuasion” alone are both unconvincing, and rather than arguing for one or the other, we need a richer understanding of what it means when voters stay home or switch allegiances.
Our best data suggests that the Harris campaign ran stronger in swing states than elsewhere, and so we should look deeper than questions of campaign tactics and policy messaging over the final months of the election for our answers to what happened here.
A uniform swing against Democrats can be seen at nearly every level and among every group of voters, but there are also particular shifts which were most pronounced among Hispanic and Asian voters. Drilling down to the precinct level in New York City allows us to find trends in Asian voting in particular that are difficult to identify nationally.
The relatively consistent trends among the (very different!) people lumped together in the census as “Hispanic/Latino” and “Asian” suggests we should not look to more granular causes among particular communities but to questions of what unites larger groups of people to understand what happened.
The Shrunken Electoral College Gap
So at a first glance, what happened is that Donald Trump won the election. He is likely to end up with a roughly 1.5-point popular vote victory. The Republicans will control both houses of Congress with a 53–47 advantage in the Senate and, depending on a few slow-counting races in California, between a 222–213 to a 220–215 advantage in the House.
These results point to the first unexpected note about the 2024 election. The Electoral College bias, which gave Trump his victory in 2016 and allowed him to come shockingly close in 2020 despite losing the popular vote by over four points, disappeared this year. Democrats somewhat outperformed their baseline in the House. Harris lost the tipping point of Pennsylvania by a margin of 1.7 percentage points, nearly identical to the national popular vote difference. What happened in the swing states and in the non-competitive states to bring about this outcome?
The analysis here is necessarily preliminary. The best studies of what happened in an election are not released until many months later, when large surveys can be conducted based on verified lists of voters. The Democratic data firm Catalist will produce a 2024 equivalent to their study of 2022 some time next year. Until we have large-scale survey data, the best material to work off is the election results themselves.
For a variety of reasons, people in the United States do not live in perfectly representative communities. Neighborhoods where particular ethnic groups predominate are common, as is sorting by class and education and even political affinity. This means that we can look at election results by county and precinct to learn about how people voted. If we can identify areas with very high rates of college education, we can make some best-guess estimates of the voting patterns of college educated voters.2
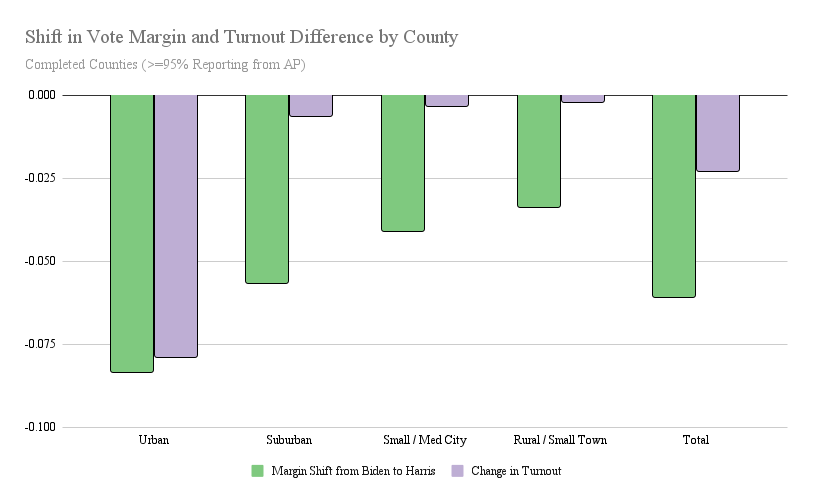
If we break out completed county returns nationwide, there is roughly a six-point shift in margin from Biden to Harris. Biden won the popular vote by about 4.5 percentage points, while Harris lost it by about 1.5. Democratic losses were found everywhere across the country, in cities, towns, suburbs and rural areas, but were most concentrated in large urban cores and their immediate suburbs.
While there were shifts of between three to eight points everywhere, the causes of these shifts vary. In suburbs, smaller cities, and rural areas, Harris lost vote share while the number of votes cast remained mostly steady. In the largest cities, typically stronger areas for Democrats, turnout collapsed at the same time as Republicans made persuasion gains.
It’s worth pausing here on questions of “persuasion” and “turnout” to discuss what these terms mean. In the abstract, a “persuaded” voter is one who was definitely going to vote and your campaign convinced them to vote for you instead of your opponent. Successful voter “turnout” refers to finding a voter who will definitely vote for you, but only if they make it to the polls, and ensuring that they cast their ballot. Even in a wholly-imagined story, it is clear the terms are vague. No campaign can know for sure that one person’s support is guaranteed if they turn out, or that another person is certain to vote and merely their choice at the ballot box is up for grabs.
But we will return to that problem later. When we are working from county and precinct data, we have a basic problem of measurement. All we know are totals. We can look at two indicators: total votes cast and vote margin. But they are not equivalent to “turnout” and “persuasion”. Even if one candidate exactly matches their vote total from the previous election, and the other sees their vote total decrease by 100, we do not know that this was all “turnout”. Possibly both candidates lost 50 voters from the previous election, but 50 voters switched their preference. Or likewise if total number of ballots cast is exactly the same and only the margin shifted, it’s possible one candidate had a bunch of their voters stay home and the other candidate turned out an equal number of new voters.
Still, these numbers are not meaningless. Both of those extreme versions of “persuasion” masquerading as “turnout” or vice versa are possible, but unlikely. Because “turnout” and “persuasion” are abstracted categories from the more complex process of how people decide to vote, all vote outcomes are some combination of the two. If we find consistent trends across multiple similar counties and precincts, we can draw tentative conclusions. We cannot say one situation was all turnout or all persuasion, but we can make reasonable guesses at the mix of persuasion and turnout depending on vote totals and margin across a large set of data.
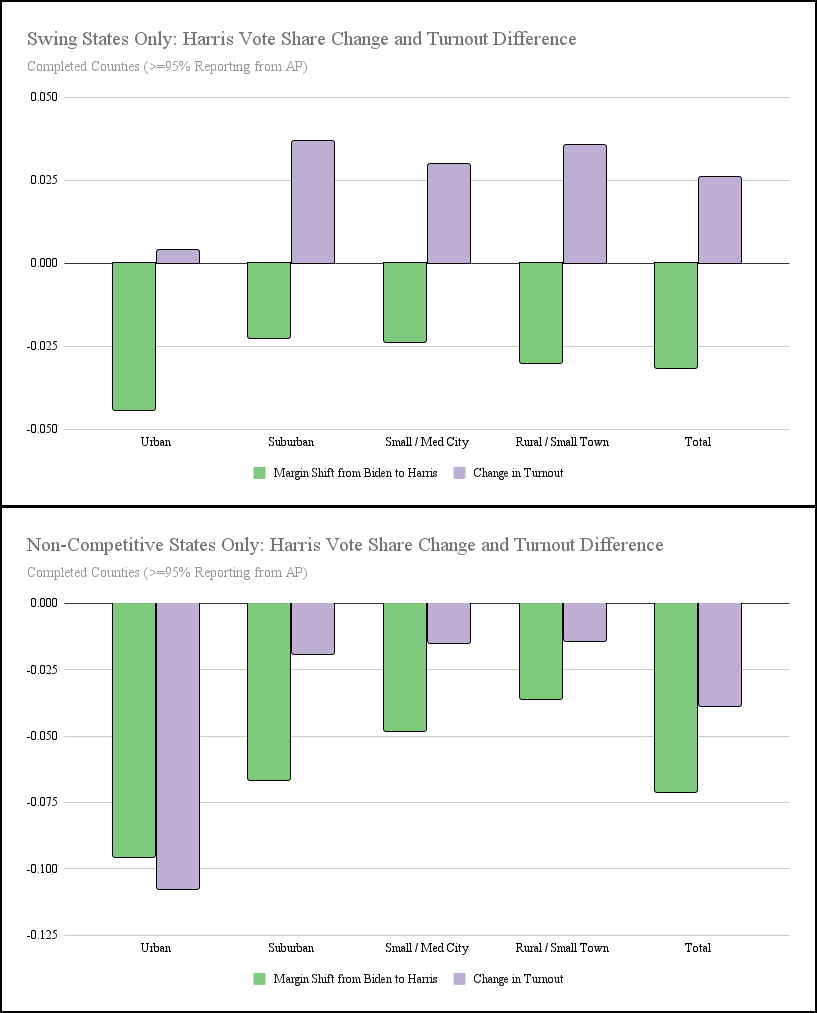
Perhaps the best example of large-scale trends across different places in which we can see these overlapping effects is that voters in swing states appear to have behaved differently from those in non-competitive states.
There is a notably uniform swing in competitive states against Harris. Turnout was still comparatively worse in urban areas than elsewhere, but it was up slightly rather than down drastically. Harris lost vote margin on average compared to Biden, but only about three points of margin rather than over seven in non-competitive states.
The simplest explanation of what makes swing states different from non-competitive states is that campaigns spent money in them but not in the non-competitive states. In areas where the Harris campaign focused both its spending and its volunteer outreach, Democrats did significantly better than elsewhere. These effects served to boost the number of voters going to the polls and improve Harris’ standing with those voters. Turnout and persuasion seem to have gone hand in hand, and shifts in both were more concentrated in urban areas.
If we want to look for reasons why the Harris campaign lost the election, we should look elsewhere than the messages with which they bombarded voters, via paid media and volunteer canvassing, in swing states in the final months of the election.
Demographic Analysis: Turnout and Persuasion
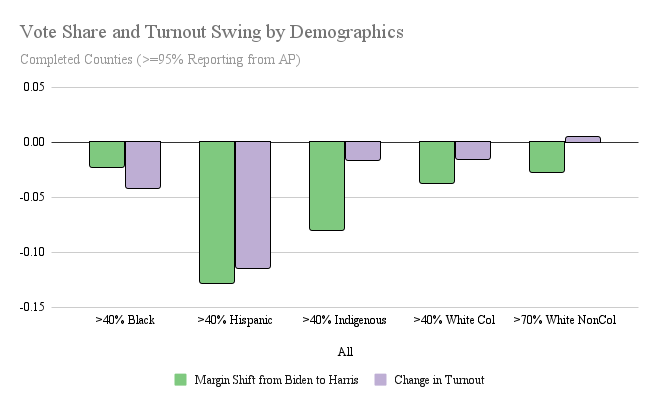
Of course, we can do more than divide up the United States by population density. Cities, suburbs, towns and rural areas may be inhabited by a lot of different people. The 2020 census offers a number of useful demographic categories, and suggests a few different things were happening in these different areas. And here we begin to see clearer evidence of distinct turnout and persuasion effects.
We see, in particular, different dynamics in areas which are more heavily white or black. There is a small but significant shift toward Trump in both more and less educated white counties, and a relatively small change in total ballots cast. This looks like a small but meaningful persuasion shift. In heavily black counties, it appears to be a turnout drop outpacing margin shift, suggesting here the problem was primarily turnout.
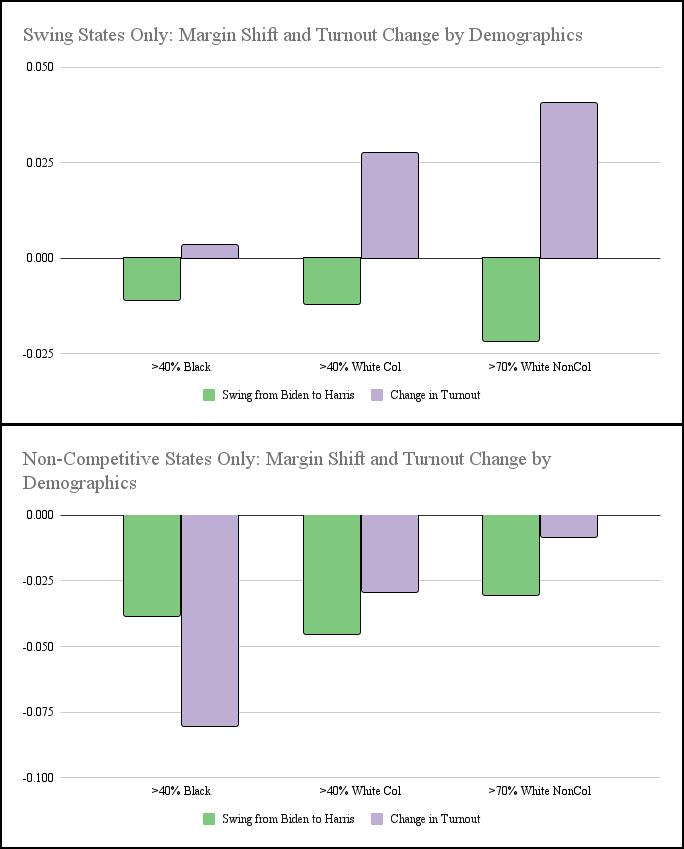
If we look at the swing state / non-competitive state split, we see something similar.
This data highlights the difficulty in 2024 of telling a clean story about turnout and persuasion. The midterm election of 2022 offers a useful counterpoint. In 2022, Democats voted at much lower rates, but the Republican vote share increased by only a small margin, and in fact did not increase in the swing states. This is a persuasion election, where gains by convincing voters to switch sides clearly outweigh the effects of getting your base to the polls.
There are no such easy stories to tell about 2024. In swing state counties with high concentrations of white people without college degrees, where Trump is strongest, there were larger increases in votes cast than anywhere else in the nation. But in swing state counties with high levels of college education among white people, where Harris expected to run even or slightly ahead, turnout increased and Harris’ share decreased. And in swing state counties with high black populations, while there was a small increase in total ballots cast, this increase was smaller than elsewhere and so cost Harris votes at the margin.
Outside the swing states, black turnout appears to have collapsed, leading to significant losses in vote margin for Democrats.
Everywhere we look, we see the hallmarks of both persuasion and turnout gains favoring the Republicans.
Hispanic Vote Share: Even Further Complexity
I could not include the Hispanic vote analysis in the above section because almost all of these heavily Hispanic counties are in non-competitive states. We would expect to see somewhat better Harris numbers in swing states, but it cannot be observed from county-level data.
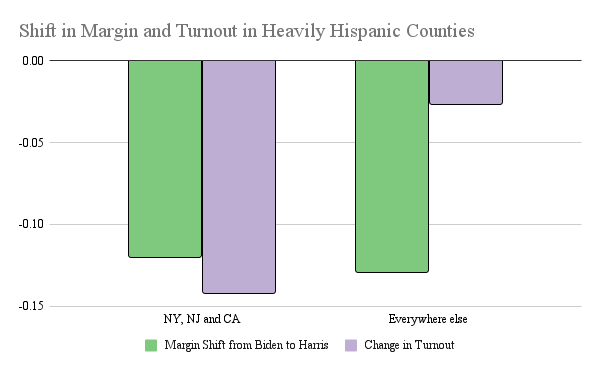
Further, and even more strikingly, the huge Hispanic county turnout drop is concentrated in New York, New Jersey, and California.
It is oddly consistent that Harris lost about 10–15 points in heavily Hispanic areas, but in some places it coincided with collapsing turnout and not elsewhere. It requires a different kind of analysis to understand what happened in Imperial County in California compared to Cameron County in Texas.
Both are border counties with close connections to Mexico, one at the furthest eastern point of the border on the Gulf of Mexico and the other almost all the way to the Pacific. In both the population is supermajority Hispanic or Latino (89 percent in Cameron County and 85 percent in Imperial County), and they live mostly in small and medium-sized cities. In both counties Trump improved his margin by close to 10 percentage points from 2020. But how he did it was very different.
Cameron County, TX
2020: Biden 64,063 to Trump 49,032
2024: Harris 54,156 to Trump 60,925
Imperial County, CA
2020: Biden 34,678 to Trump 20,847
2024: Harris 23,229 to Trump 22,433
Trump added fewer than 2,000 votes to his total in Imperial County and over 10,000 votes in Cameron County. But he actually improved his margins by slightly less in the latter because of a decrease in votes cast in Imperial County that crushed Harris’ totals.
The paradox here is that two demographically similar groups of voters, in relatively similar areas, split their votes by a similar margin, but the way they split their votes was almost a total mirror image of the other. One offers a paradigm of a persuasion shift and the other an equally paradigmatic turnout effect. And despite that, both counties ultimately shifted toward Trump at similar aggregate rates.
While I cannot speak to the local concerns in either county that could have driven these effects, I suggest that if we stick with thinking of “persuasaion” and “turnout” as wholly different things, we will struggle to understand what happened here.
One important piece of context for these shifts is that they did not begin in 2024. Rather, after some regional swings in Hispanic voting patterns in the Rio Grande Valley and South Florida in 2020, the 2022 election saw large shifts in Hispanic and Asian voting patterns spring up across the country and most notably in New York City.
New York City: We Matter
While I produced this analysis of the 2024 election in New York City for a local Brooklyn political club, and for them and for me the interest in New York City is obvious but parochial, there are good reasons to look to New York City regardless.3
Kathy Hochul in 2022 only won the two-party vote in New York City by a 69–31 margin, after Biden won 76–24 two years earlier. This year, Harris not only couldn’t claw back any of Hochul’s losses but in fact ran slightly behind her in the city, taking only about 68 percent of the vote.
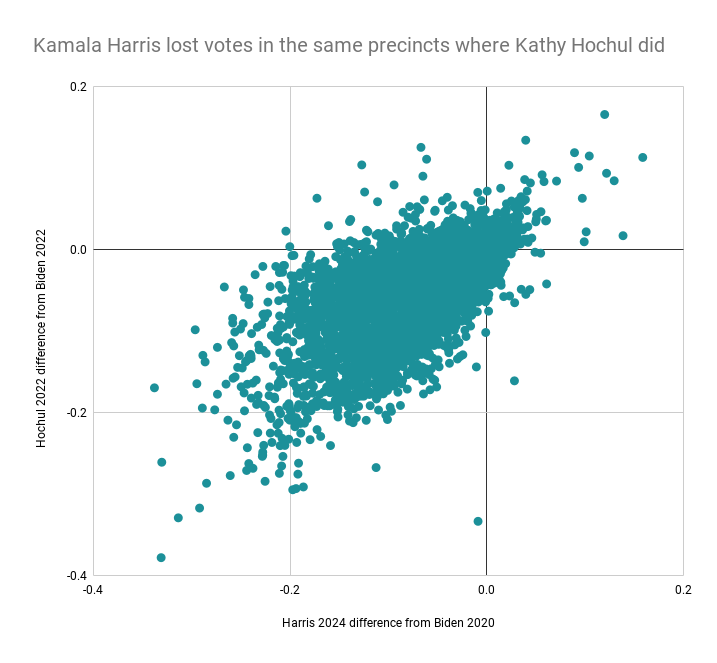
And it was mostly the same votes lost in the same places, despite turnout being much lower in 2022, as is common in midterm elections.
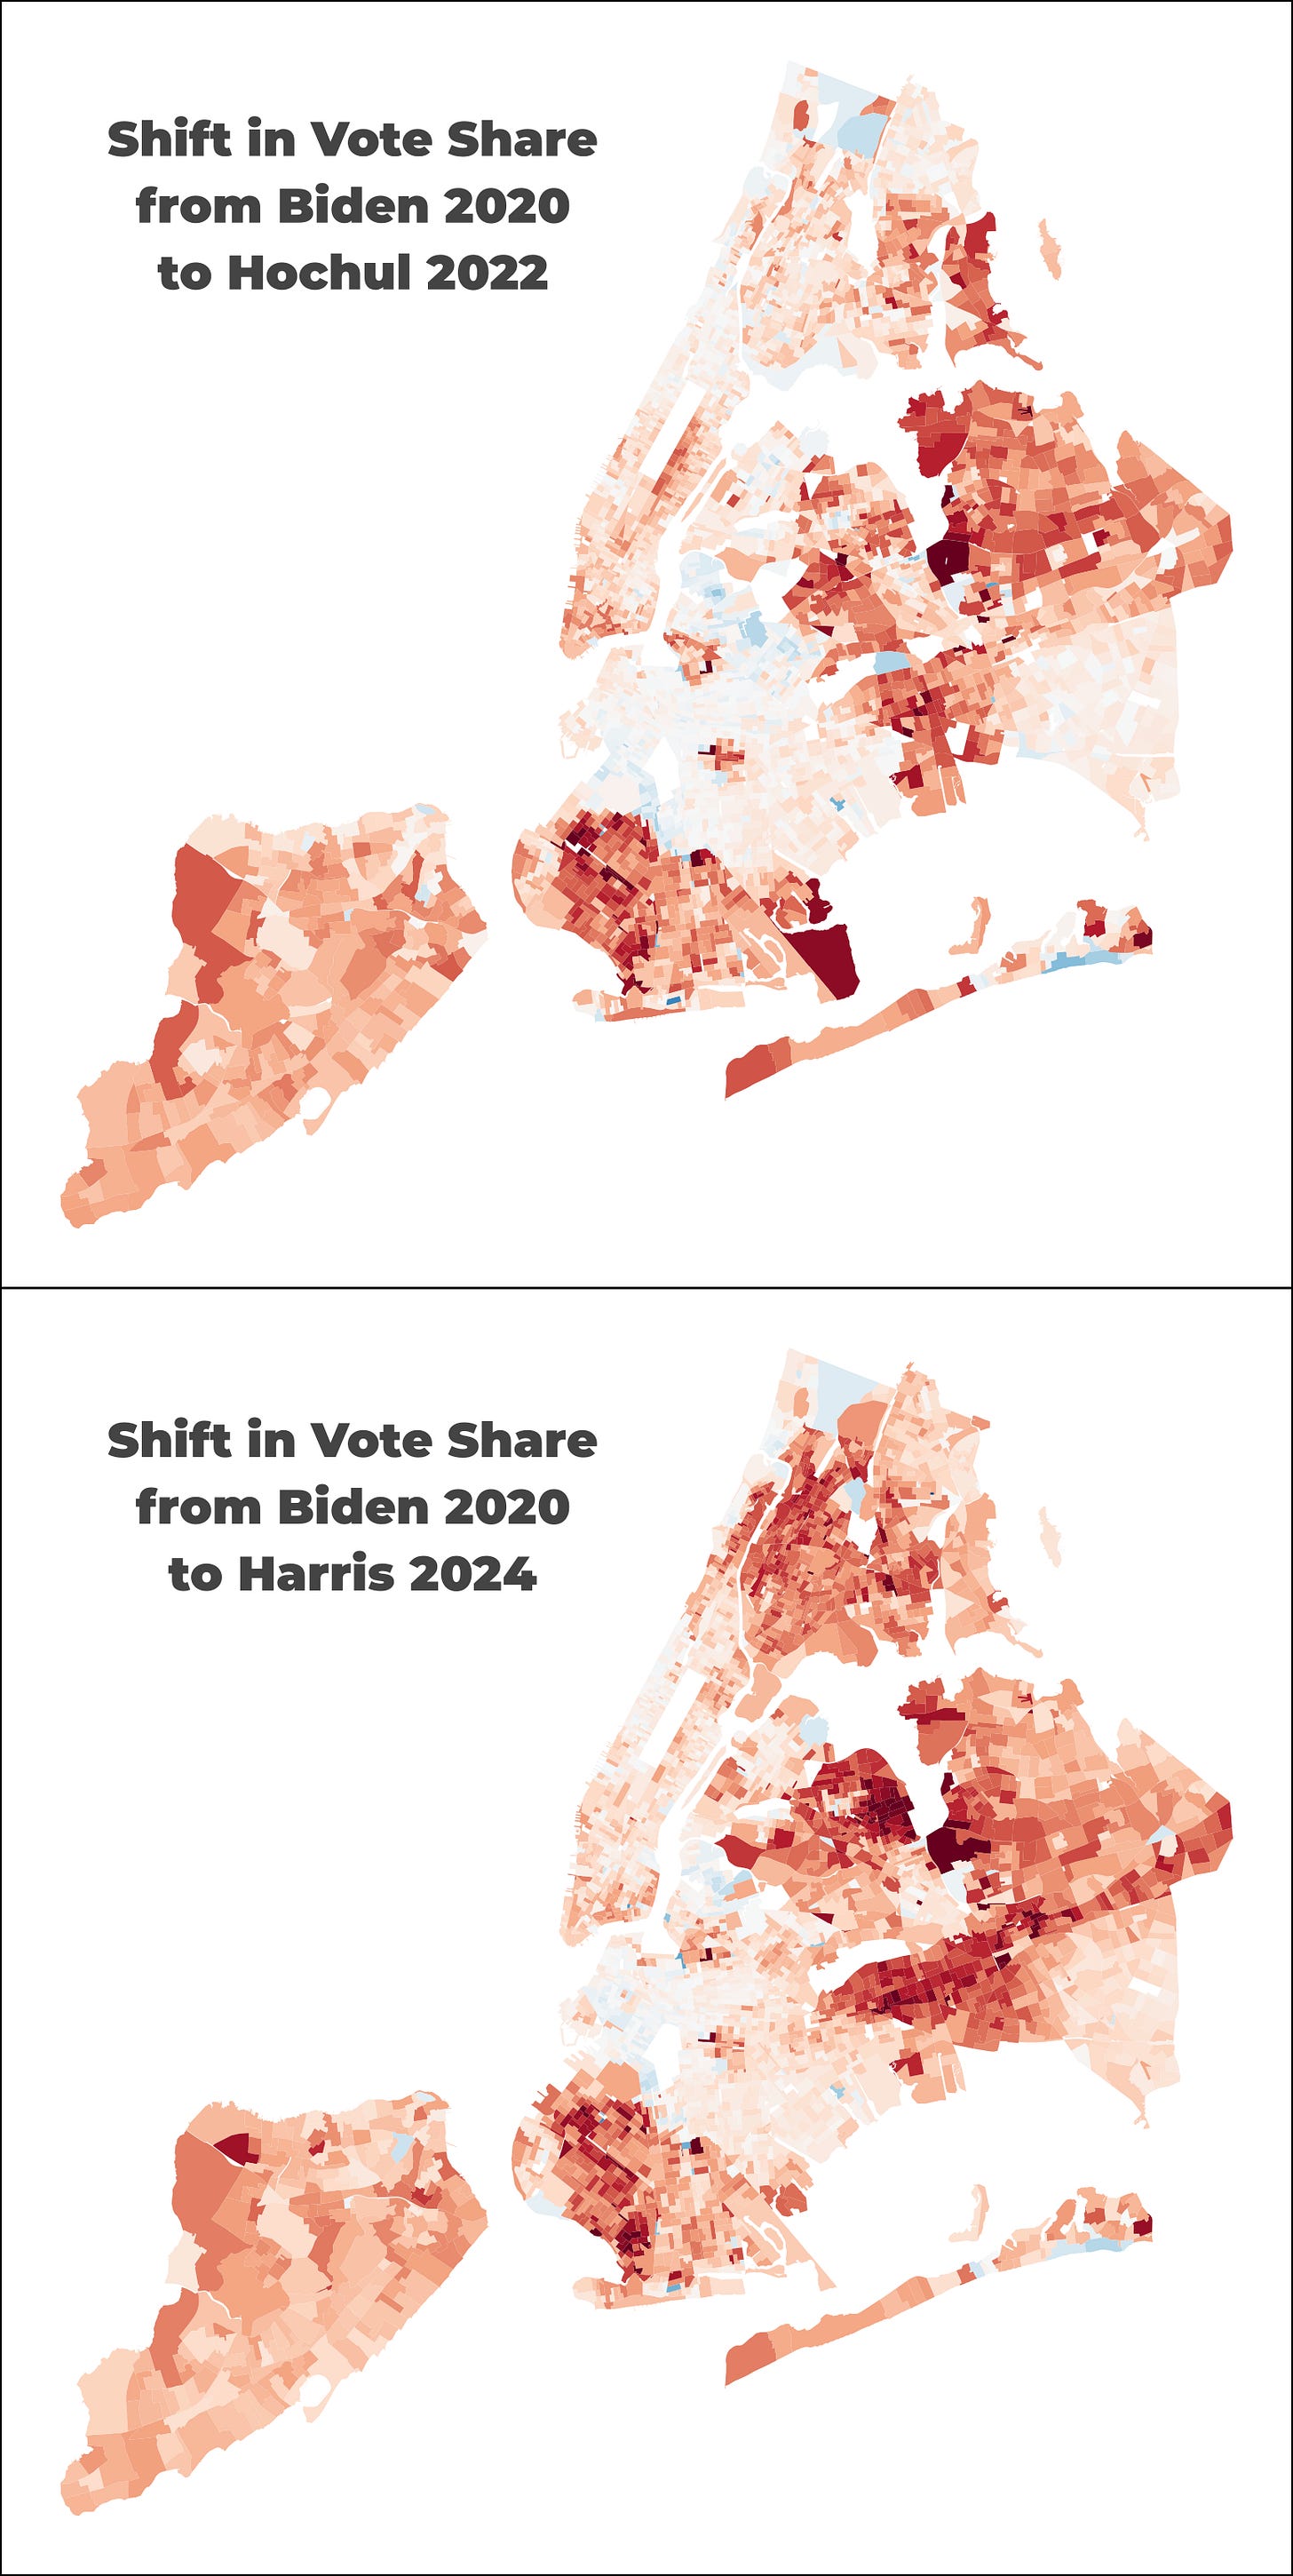
These maps show swing from Biden to Hochul/Harris in darkening shades of red and swing to Hochul/Harris in blue (if you squint).4
The Republicans picked up votes in conservative Staten Island while Democrats held vote share but could not increase it in their strongest areas of Manhattan and Brooklyn. Democrats took massive losses in Southern Brooklyn and most of Queens besides the areas near the East River. The biggest difference between these maps is that Harris lost further vote share in the Bronx.
Overall, the swing went against Democrats at similar rates in similar places.
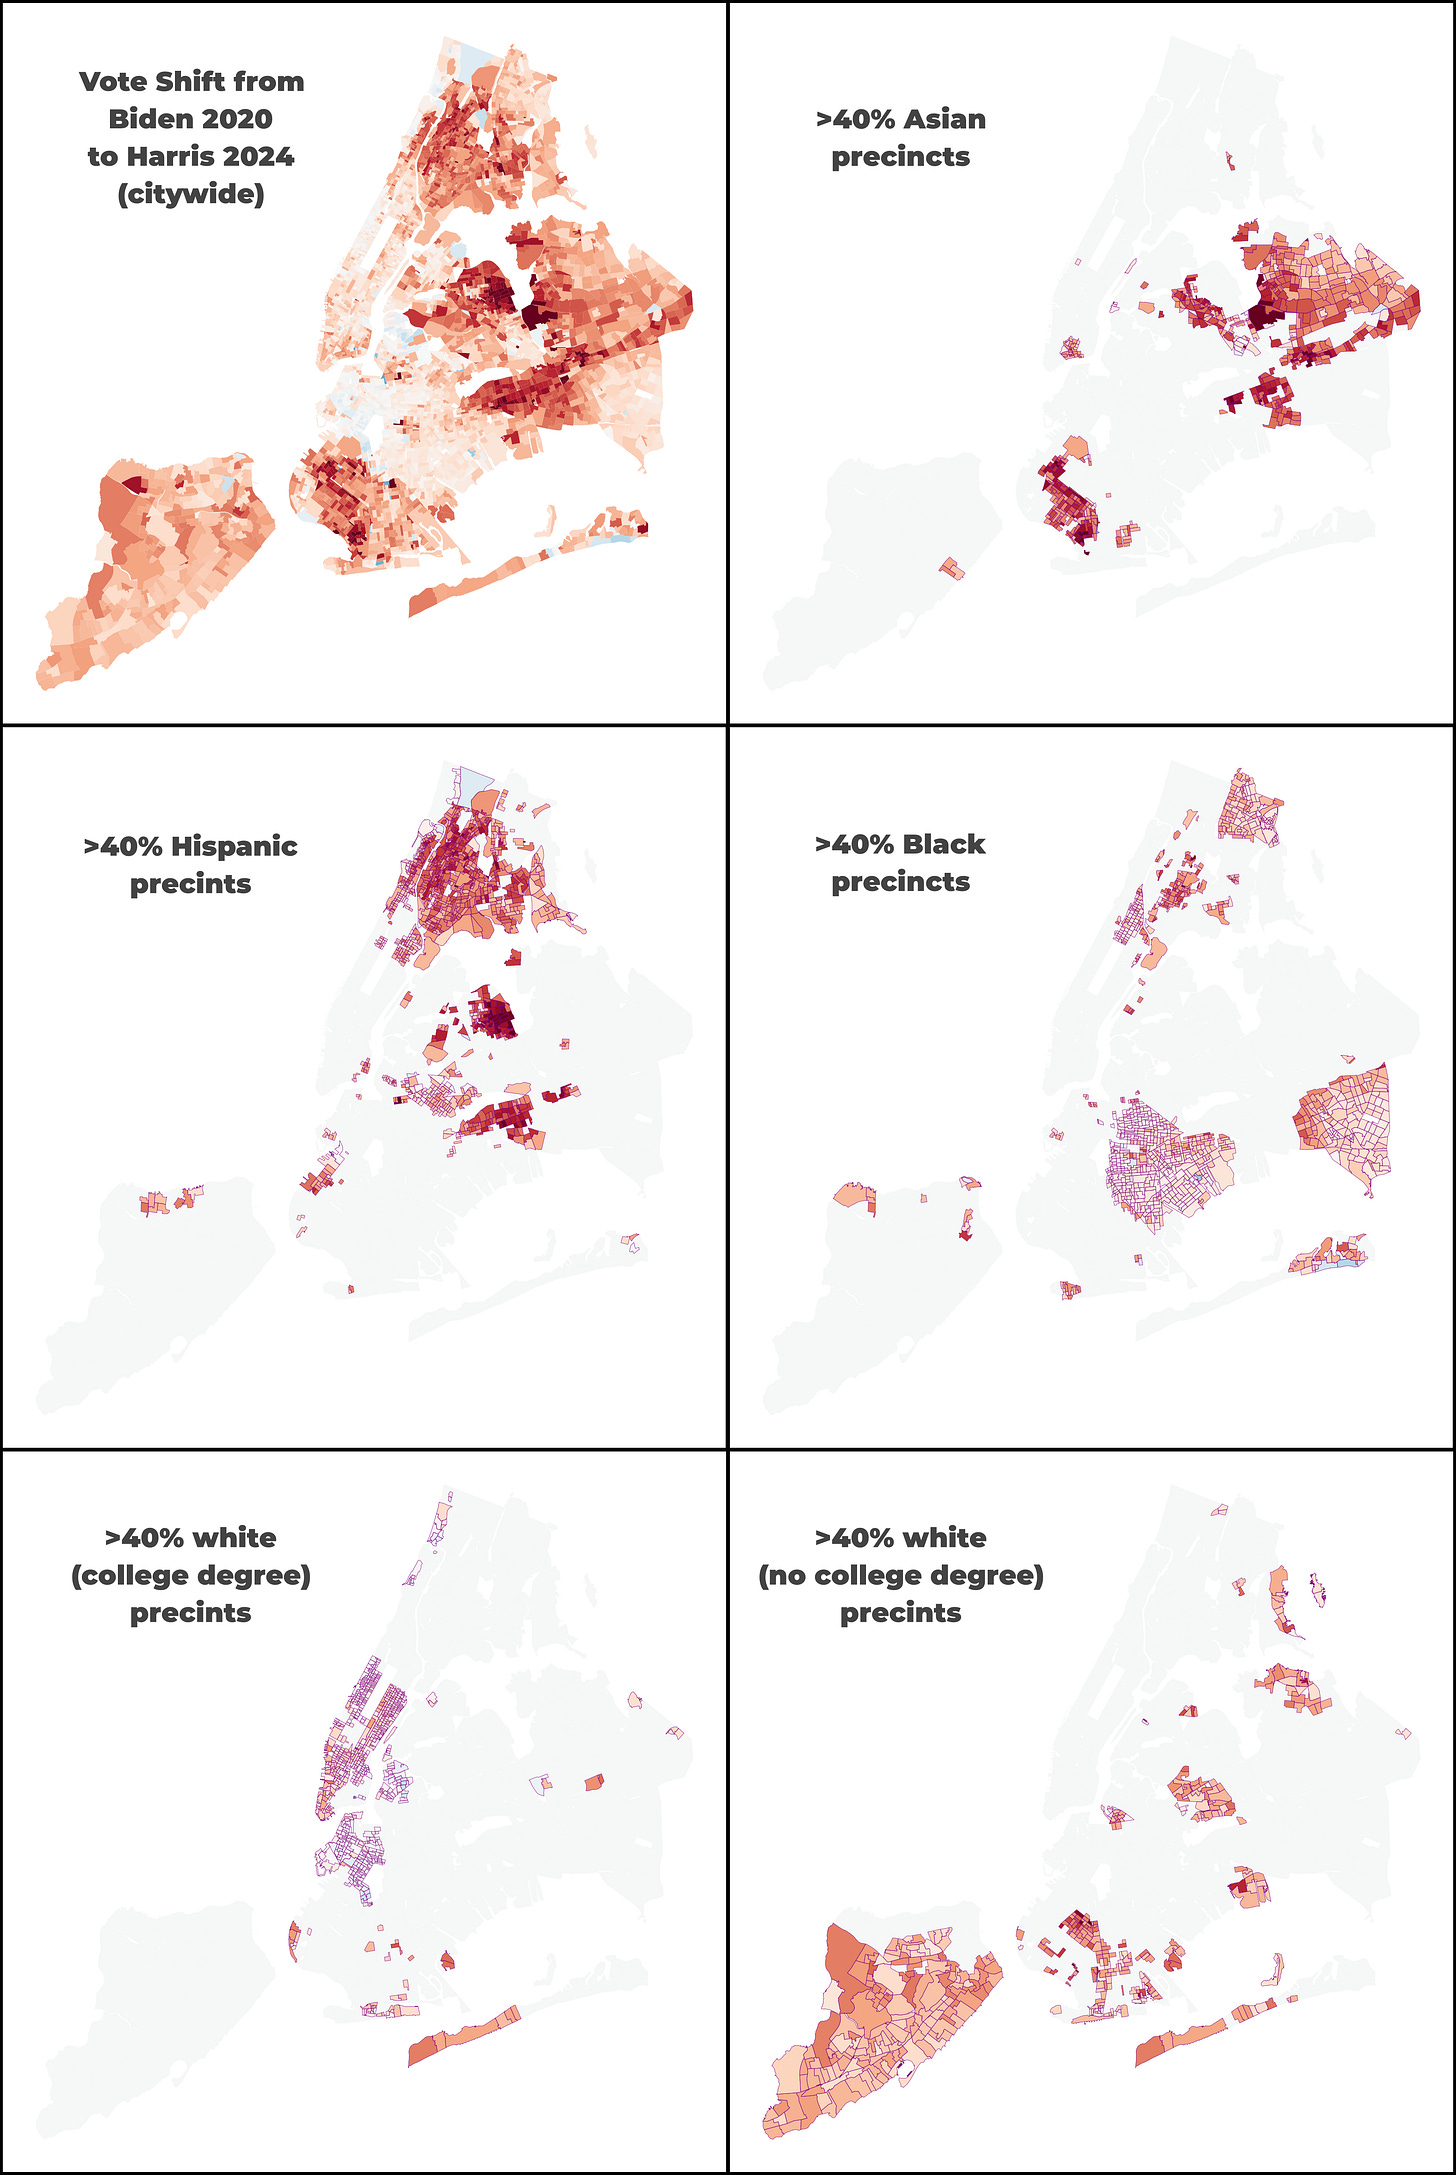
Further, if you know the geography of New York City, you will know that the areas where both Hochul and Harris lost the greatest vote share — the reddest areas — are some of the most heavily Hispanic and Asian areas of the city. The neighborhoods where Democrats maintained their 2020 vote share are neighborhoods with either large black populations or high rates of college education among the white population.
Breaking up the city by these five categories can explain a huge amount of the vote shift. These five maps highlight precincts in New York City by these demographic characteristics.
The nationwide county-level data could not identify this Asian vote swing because there are few counties in the United States with such predominant Asian populations. But by zooming in to the precinct level in New York City, we can see this vote shift happening and that it had begun by 2022.
Black and college-educated white precincts appear in very pale colors because of the lack of shift there compared to heavily Hispanic and Asian precincts.
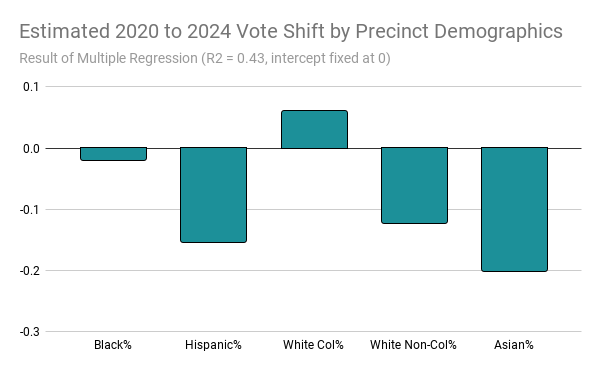
With these five demographic categories showing such visibly clear effects on the maps, I tried a multiple regression by demographics against Biden→Harris vote shift, and found a significant effect.
The R2 of 0.43 means that just under half of the variance precinct-to-precinct in vote shift can be explained by just these five demographic categories.
The massive vote shift in Hispanic precincts matches the nationwide county-level studies. It is in turn now matched by even a somewhat-larger effect in heavily Asian precincts.
One thing that is somewhat different between New York City and the nation is the non-college white effect. Across the country we see only small persuasion effects among white voters. But in New York City there is a much larger swing. I have two hypotheses here. First, these are somewhat different population effects. There are more than 1,000 counties with (adult) populations over 70 percent white-non college degree, and only a handful of precincts in New York with such a concentration. We are looking at just 40 percent and above in this map.5 Second, there are very high rates of evangelical religion and southern regional conservatism in non-college white areas nationwide, both of which are rare in New York City.
If my hypotheses are correct, it suggests that the Democrats’ problems with Hispanic and Asian voters run in parallel with problems with (Northern, non-evangelical) white voters without college degrees.
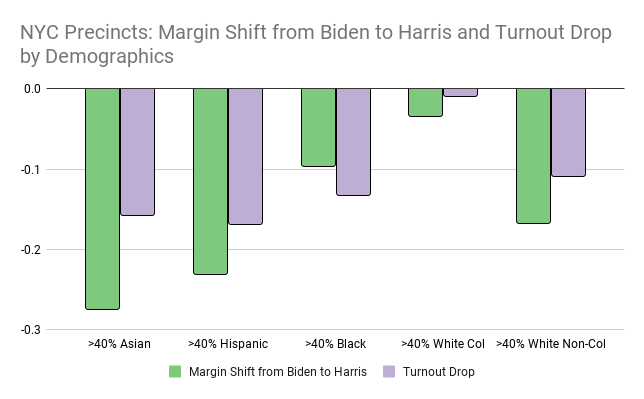
Now, so far this has just been looking at vote swing in New York City. Because of the methods I had to use to estimate voting precincts — New York City, very frustratingly for anyone trying to do election analysis, changes its precinct boundaries every year — it’s not possible to get really granular turnout numbers for regression or mapping. But I can aggregate precincts as I did with counties.
We see total ballots cast dropping everywhere except areas with highly-educated white populations. There is an even larger drop in vote share in more heavily Hispanic and Asian areas. You can see, I think the outline of a story here where Democrats struggled with turnout among almost all demographic groups, lost some vote share to persuasion among almost all demographic groups, and in particular lost tons of votes to persuasion among Hispanic and Asian voters. This possibly also applies to white voters without college degrees outside the South.
So What Have We Learned?
The main intervention I wanted to make here was against easy claims of a turnout election or a persuasion election. It is clear that turnout and persuasion had a complex interplay here, and while we will be able to say more once comprehensive surveys has been done, I think the biggest question this raises is exactly what “turnout” and “persuasion” imply. Why does it seem to be the case, for instance, that there were collapses in turnout among Hispanic voters and also collapses in Democratic support among those Hispanic voters who did get to the polls? Why were these drops arrayed differently across different geographic regions?
There has been a fair amount of polling on the sort of disaffected, weakly-attached, infrequent voters that may well have turned against Democrats in this election. This overview by Nate Cohn at the New York Times found that Democratic-leaning voters who skipped the 2022 or even 2020 election were the crucial voters for Democrats to turn out and persuade in advance of 2024. These voters tended to be younger and non-white compared to the population at large, and they were less likely to have a college education. They were less motivated by the defense of democracy or abortion rights, they were much angrier with the leadership of Joe Biden personally, they got their news from social media and were often mistaken about who had been responsible for overturning Roe v. Wade, and they were broadly much more unhappy about the state of the country. These voters, crucially, were at risk of either voting for Trump or choosing to stay home. This article reads in retrospect like a description of the voters we have been finding either dropping out or flipping to Trump in the demographic analyses.
The sorts of voters who stayed home and the voters who switched allegiances may have more in common than the contrasting categories of “turnout” and “persuasion” might suggest. The voters who were unlikely to make it to the polls for Biden or Harris, and those who were at risk of switching their vote to Trump, were not obviously two different groups of people. The interplay of turnout and persuasion in the data might be less confusing if we are seeing different effects on the same kinds of people.
The notion of finding, underlying all this variance, “the same kind of people,” is also what I am taking away from much of this demographic analysis. In particular, I would highlight the finding in New York City that areas with larger populations of white people without college degrees have shifted against Democrats in ways that seem to run parallel to somewhat larger shifts among Hispanic and Asian voters. While there are certainly specific questions of ethnic identity and experience, and quite possibly crucial questions of language in messaging, the similar trajectories of these voters from 2020, to 2022, and then on to 2024 suggests we should be looking for commonalities more than differences. What would cause Democrats to lose vote share among such disparate groups at similar rates?
Of course, this data also reveals some real demographic divergences. Democrats appear to have lost some ground among white voters with college degrees, but with steady rates of voting and no more than uniform swing margin loss, it does not appear Democrats have any deeper problems here. And with black voters, the lack of extreme swings in voter preference despite large drops in turnout is notable. The traditions that have made black voters, in the words of Chryl Laird and Ismail White, “Steadfast Democrats,” seem to have held even as turnout declined.
And this brings me to my third takeaway, that 2024 did not come out of nowhere. The losses that Democrats took nationwide, with notable concentration among Hispanic and Asian voters, were presaged by New York in 2022. The losses among white voters without a college degree follow from an even longer-running political realignment. This loss was driven by an apparent nationalization of trends that were merely regional in 2022. And it is hard not to see the exception, college-educated white voters, as indicative of the larger trend. Most black, Hispanic, Asian and white voters do not have college degrees. If patterns of Democratic voting among ethnic and racial minority populations are weakening, while only the too-small group of people with college degrees flips the other way, the future of the party is at risk.
If that is true, and if it was a set of longstanding political traditions and institutions which prevented black voters from turning against Democrats at the same rates as most other voters, is this a bulwark the party can rely on for the next few elections? It worries me deeply that Harris’ loss could have been significantly worse if there had been more significant shifts of black voters against the Democrats and not merely a drop in turnout, which in turn was concentrated outside the swing states.
A broad set of national trends are breaking against the Democratic Party right now. These trends appear in national voting patterns and in greater detail in New York City local elections. But we should not view them as the only factor in this election or elections in the future.
The International Context: Feel the Dialectic
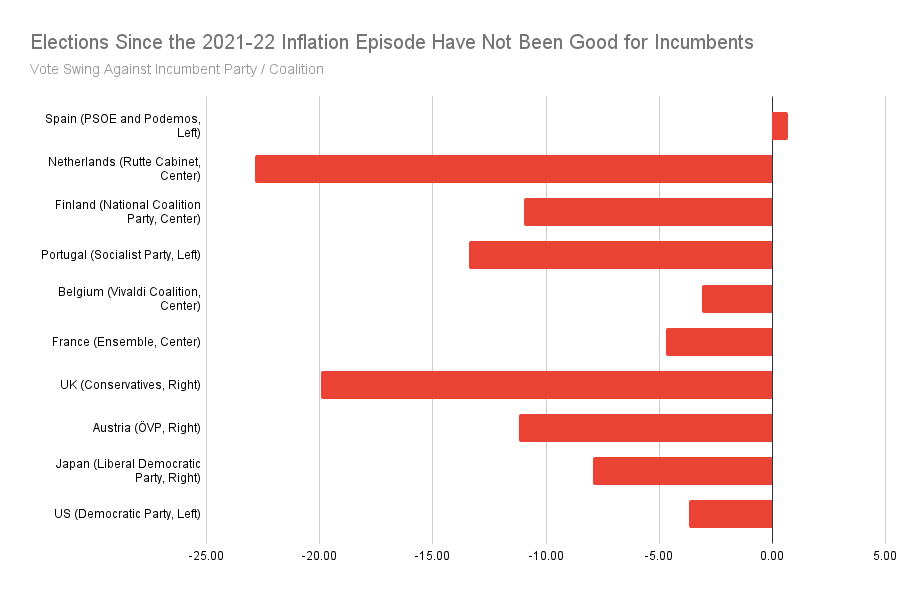
I have so far split time between looking at national and local trends in the US election. Taking a wider scope and looking at elections worldwide tells a different story. As John Burn-Murdoch at the Financial Times has pointed out, incumbents have lost every election in 2024 worldwide. Of course, it is unlikely that it is something specific to the calendar year 2024 that is driving these results. Voters across the globe, and particularly in affluent countries with little experience of inflation in recent decades, rebelled against the rises in price level caused by the disruptions of the pandemic and by oil and gas supply shocks following the Russian invasion of Ukraine. If we look at elections in 2023 and 2024, in such affluent countries, we find a similar although not entirely unanimous trend.
Pedro Sanchez of Spain’s PSOE breaks the trend. But the average is terrible. Inflation has uprooted governing coalitions around the world. And this average also cuts against peculiarly ideological takes on the effects of inflation. Centrist coalitions and right-wing parties6 have been swept out of office just as easily as more left-leaning governments.
It seems likely that the 2024 election in the US was fought on a battlefield that favored the Republicans by much more than one would expect any future election to tilt. The trends that seem like they doom the Democrats probably would not have peaked in a Trump victory in 2024 if it weren’t for inflation, and so these trends are probably more likely to regress temporarily in 2026 and 2028 than to continue at the same pace.
There should still be every opportunity for the Democratic Party to recover from this defeat and to address head-on the demographic realignments that put the future of left and center-left politics in this country at risk.
Permit Me One Last Take
I have sought to avoid arguing about policy messaging in this piece. I know everyone wants to know if the Democrats moved too far to the left in their platform and messaging, or perhaps if they moved too for the center instead. In part I have avoided such topics because these questions will only be answered by larger-scale survey methods and are nearly impossible to grasp from precinct data.
But I have a strong hypothesis that focusing on policy messaging narrows the scope of political analysis far too much. In Cohn’s polling, the uncertain voters lacked particularly clear ideological viewpoints and tended both toward a rejection of leading progressive issue positions and a desire for a vague but more radical shift in the direction of the country that would not be answered by moderate, “commonsense” policy alignments. And more than anything else, they really hated the specific people leading the Democratic Party.
This is not to say that Democrats should not pore over the data on voter preference and make sure their messages resonate with majorities of voters. But I worry very much about a party that only seeks to recalibrate its policy messaging.
What I think is most indicative about these voters is not their ideology but their weak social and political attachments. These are voters whose preference and likelihood of voting are equally uncertain because there are few ties of any sort binding them to a political coalition. It seems like a mistake to reach out to disaffected people who do not trust traditional institutions or the fairness of the modern world, with just a better set of messages delivered through traditional channels.
These deeper and richer connections with voters can only be built through institutions, and the current Democratic Party profoundly lacks such embedded institutions. For most of the last decade I have been organizing with New Kings Democrats to build a better Democratic Party locally. In 2024, I volunteered with New York for Harris/Walz to connect Democratic volunteers with needs in swing states and run buses to towns across Pennsylvania. This organization was expanded suddenly by a group of volunteers to meet the volunteer energy that followed on Biden’s stepping down. There were no existing institutions in Brooklyn or New York City to handle this labor, despite all the elected Democrats here. This is an indication of what Daniel Schlozman and Sam Rosenfeld call “Hollow Parties.” Modern party organizations have an incredible capacity for fundraising and ability to collect the votes of millions of Americans in regular elections, but they maintain only a minimal presence in American communities beyond those strengths, and because of that the parties lack the ability to enforce discipline and set goals for their ideological coalitions.
Even if the whole problem were policy messaging, and someone figured out the perfect policy messaging to win elections, how would the Party build consensus for this new direction and then enforce discipline to maintain it?
The answer to the profoundly worrying trends in the 2024 electoral data must be institution-building and not mere revision of policy messaging. This institution-building must lift up new leaders who can differentiate themselves from the Democratic leadership that proved so unpopular in recent years. There is still time for the party to adjust and to build an apparatus that can win elections. But we must confront 2024 as not only a profound loss but an indication of continuing trends against the Democratic Party that must be stopped if the party means to regain majorities and make a better world.
In part this is because I want it to be interesting for people who don’t attend local reform club meetings in Brooklyn. But also, because I am cursed with being me, I went back and collected updated data on completed county and precinct vote after giving my talk. And I found new data challenged some of the easier narratives I had leaned on in that talk. This in turn required a lot of new work to fit it all together. At the same time, the discourse over what happened in the election shifted, and I felt there was a need for a set of firmer interventions in this discourse based on what I found in the data. And so here we are.
There are risks to this sort of analysis, but it has stood up over time much better than the other form of early analysis you’ll see around: the exit poll. Exit polls are simply not built to carry the explanatory load they are given after elections. It is impossible to secure a truly representative sample in an exit poll, and so when they are re-weighted to match the actual election results, the re-weighting typically creates even larger errors in subgroups. If you have seen someone tell you that Latino men or Gen Z women voted in a certain way, they were almost certainly drawing on exit poll data that cannot be trusted for this sort of analysis.
because it’s the greatest city in the world the big apple baby concrete jungle where dreams are made of
Because New York City changes its precinct boundaries every year, these maps involve a little bit of estimation. I have taken the 2020 and 2022 precinct boundaries and mapped them to the 2024 precincts and extrapolated vote based on physical overlap, which works well enough but definitely introduces a few errors in a few places.
This is why parts of the Rockaways appear in both the “college white” and “non-college white” maps, those districts are very heavily white and split about evenly between college and non-college educated. I thought about snipping them off one of the maps but didn’t want to cheat.
Don’t yell at me for calling something “left” or “right” I pre-emptively agree with your criticisms of these necessarily shaky claims.


