


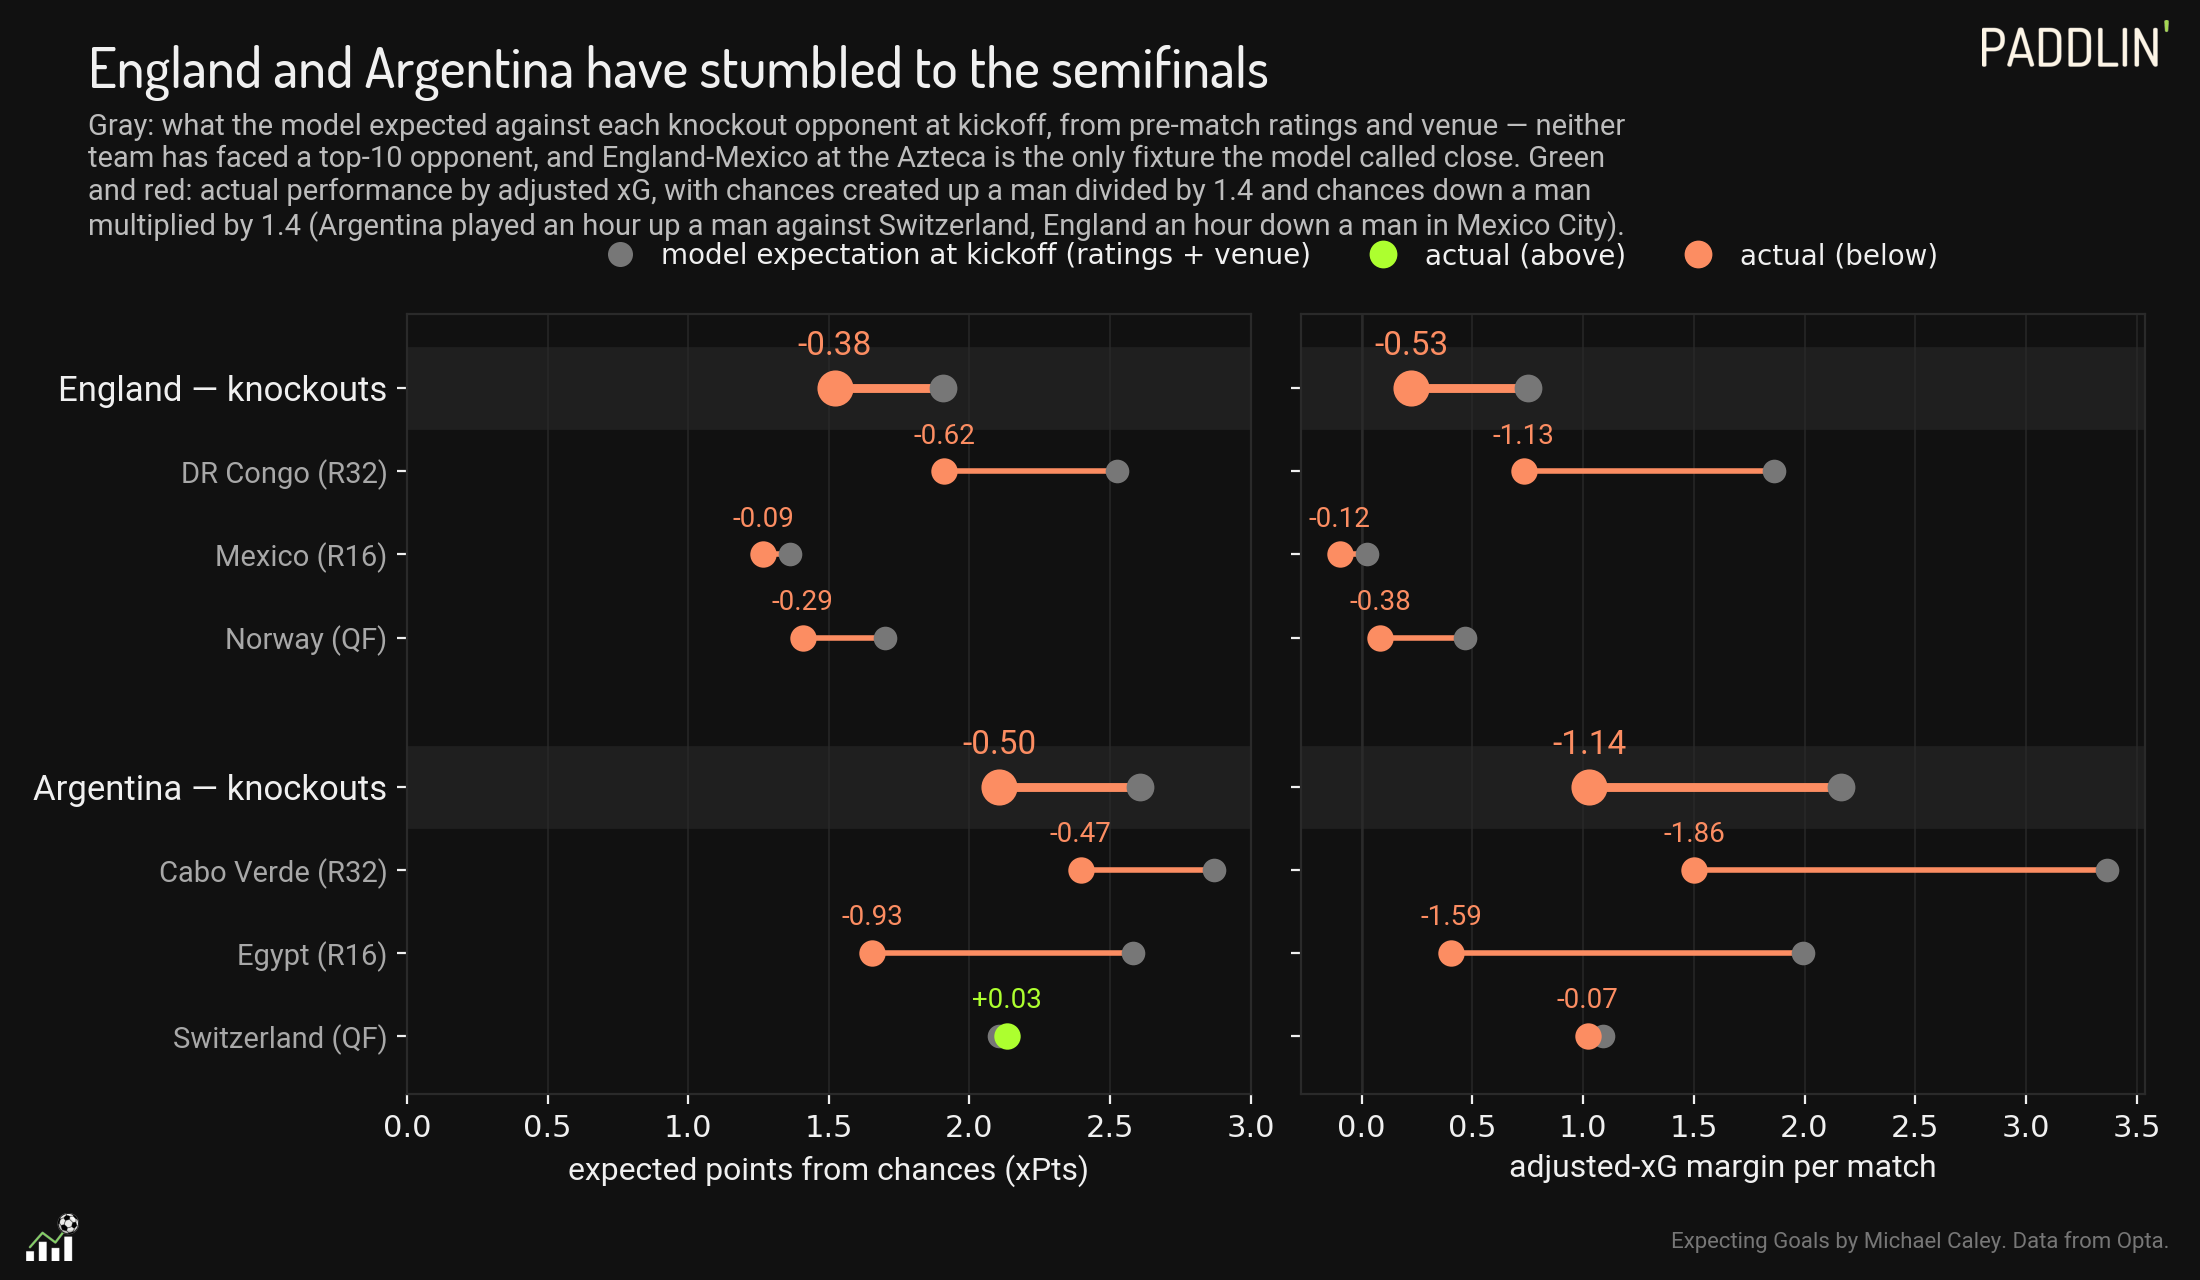
England and Argentina will meet in the World Cup semifinals, after late goals saw them past Norway and Switzerland on July 11. In both matches, not only did the favorites need a dramatic extra time winner, but each match was legitimately tight up until that point in the underlying numbers as well. This has been true for both Argentina and England throughout the knockout phase. Neither have been able to translate their obvious advantages in talent into easy or convincing victories. While England kicked off their World Cup with a dominant win over Croatia, the performances since have been consistently uninspiring, and Argentina have yet to notch an impressive victory despite many opportunities against weaker sides.
In the knockouts, both teams have underperformed PADDLIN’ model projections overall, and in just about every match. A red-card adjustment is necessary here as otherwise England’s performance against Mexico looks worse than it was given Mexico’s man advantage, and the reverse is true for Argentina’s win over Switzerland.
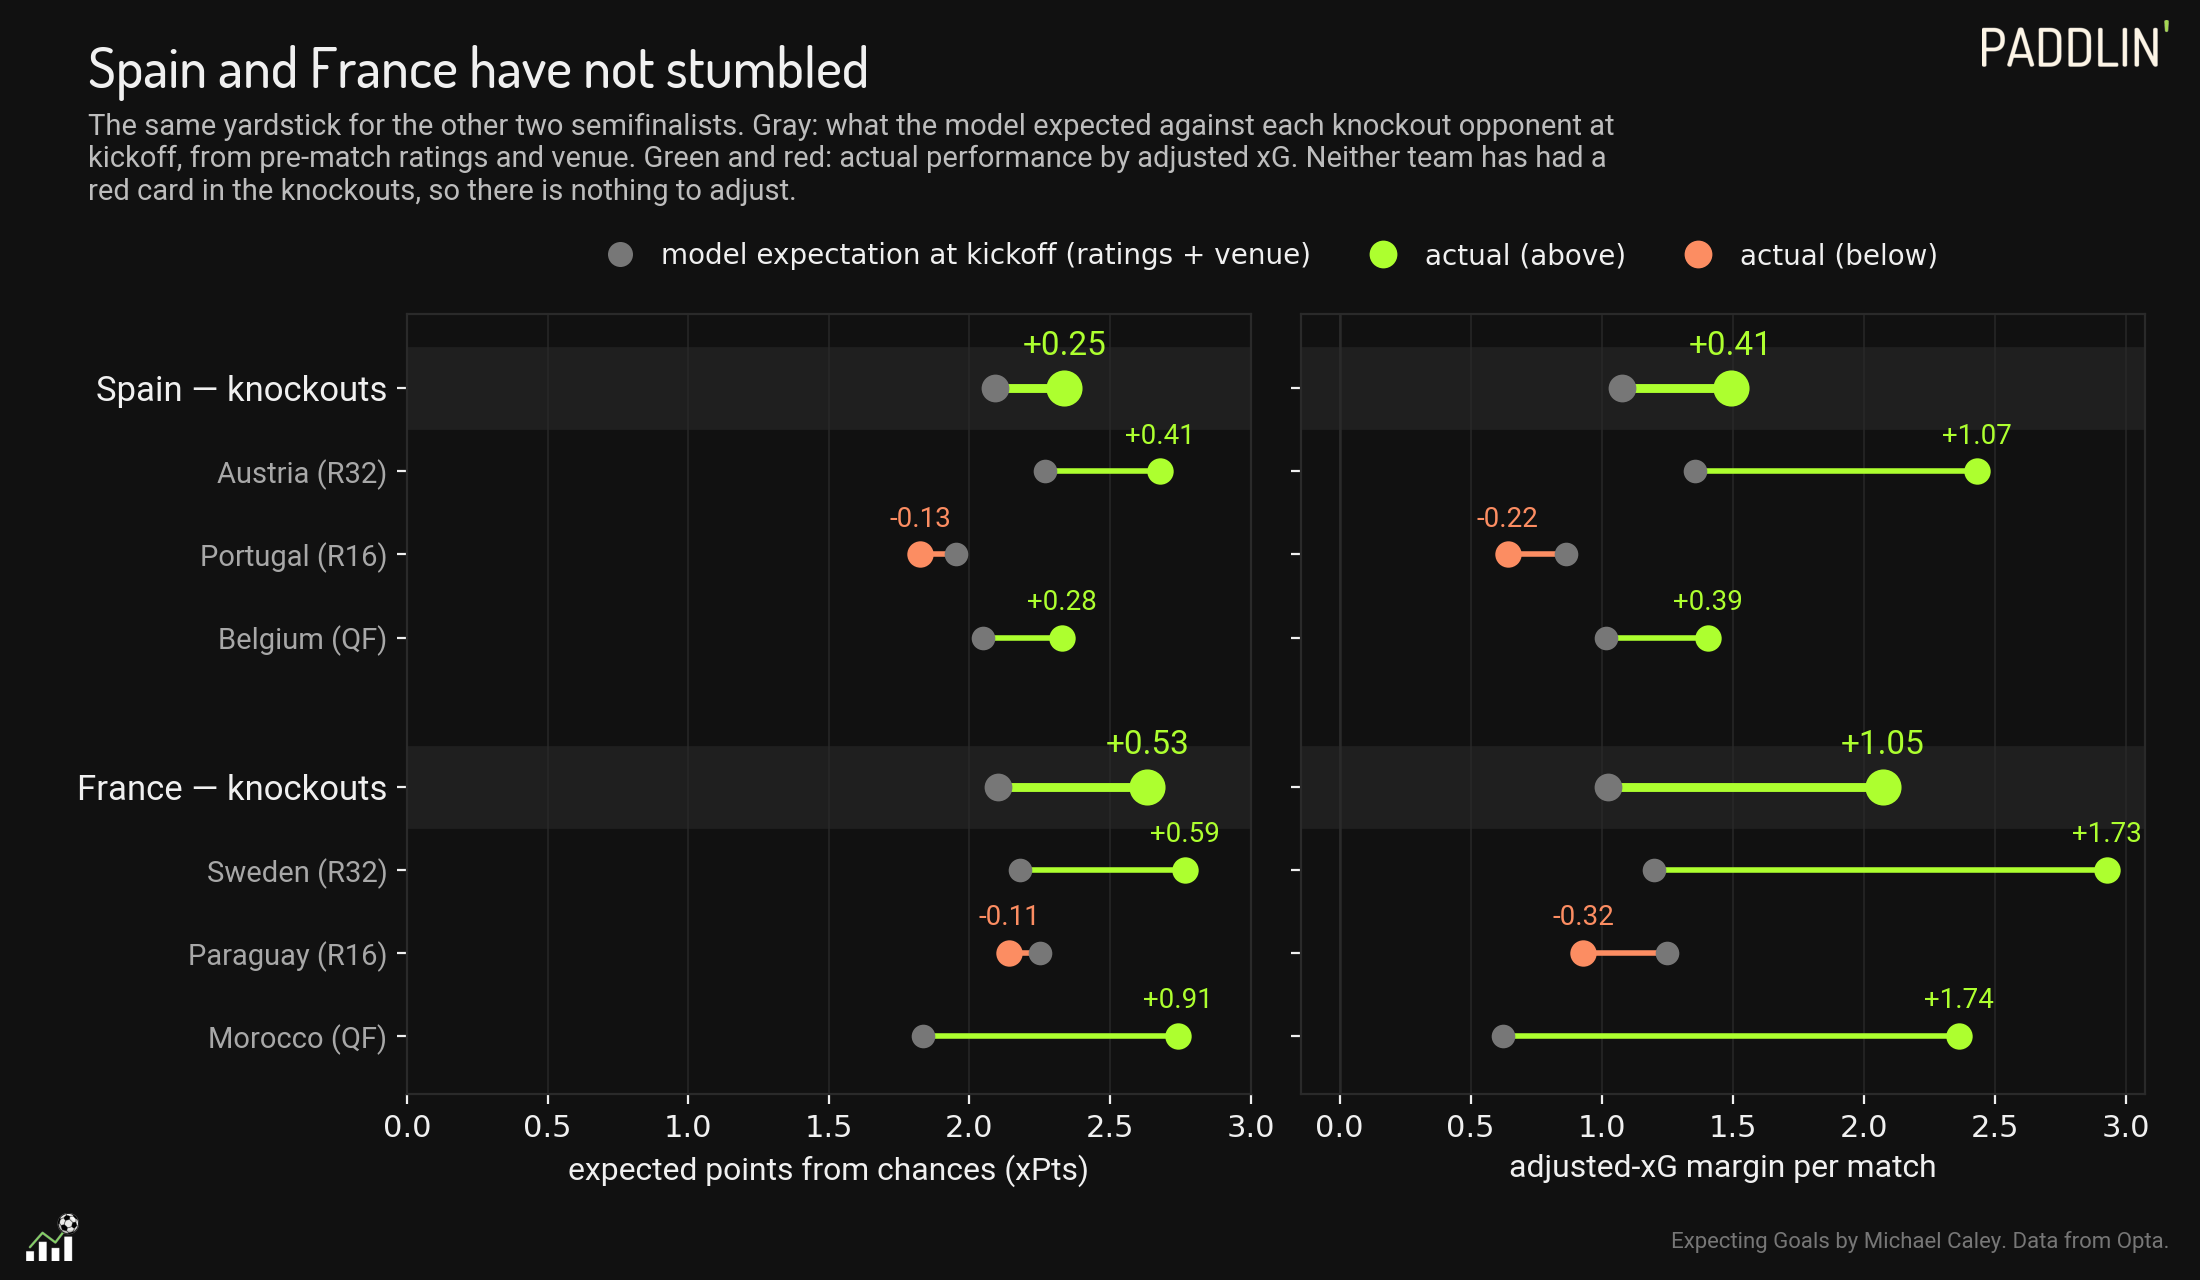
On the other side of the bracket, the story is different. France have been clearly the best team at this World Cup match to match, with Spain comfortably second-best.
It is not surprising, then, that PADDLIN’ rates the winner of France-Spain as significantly more likely to win the tournament than the winner of the other semifinal, by a margin of 56 percent to 44 percent.
But beyond that finding, PADDLIN’ produces different results from some of the other notable projections. The gambling markets have gone all in on France as the most likely winner. The Silver Bulletin PELE model is closer to the gambling markets than PADDLIN’ is, but clearly in between the two on most issues. (PELE likes Argentina even somewhat more than PADDLIN’ however.)
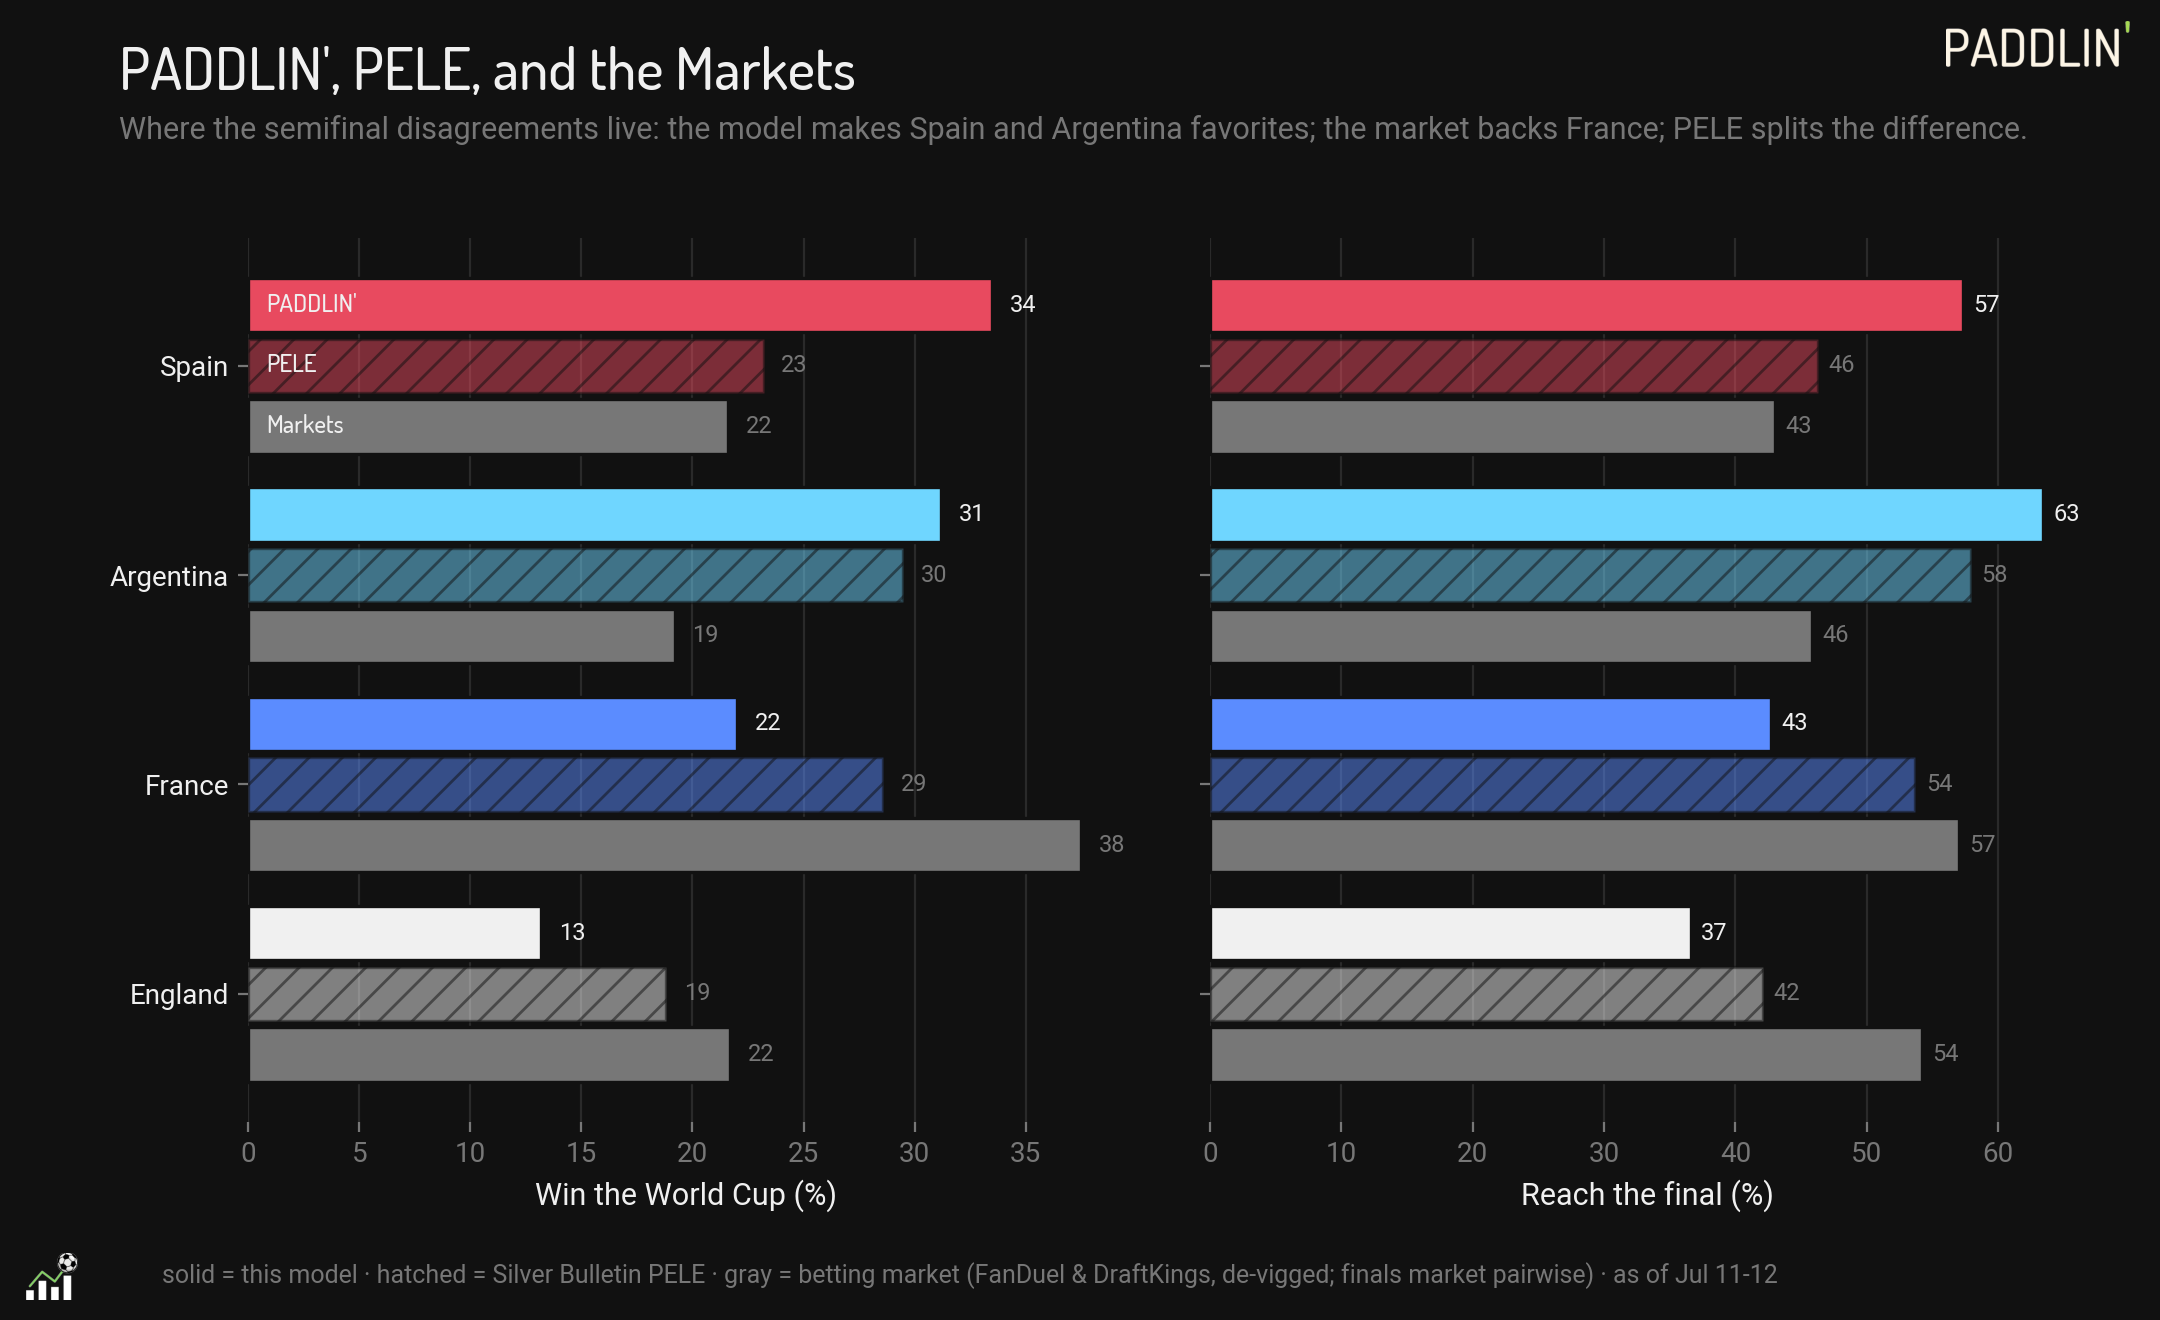
This is probably the question I have heard more than any other on social media. Why Spain? Why not France? Why Argentina?
And as I have watched the games, my own opinion has somewhat diverged from the model, too. In the two-part World Cup semifinals preview on the Double Pivot podcast, we agreed that there were good reasons to favor France, at least at the margins.
And I was even more bullish on England’s tactical edge against Argentina in the preview podcast for that match.
So when I find my own model’s results relatively suspect, obviously it is time to write about it.
The purpose of this newsletter is not to justify the PADDLIN’ results or to reject them. It is certainly not to advocate for any particular gambling strategy.1 I want to explain how the model works, and I put together these little studies in great part to understand it better myself. I know all of the various individual modeling decisions that went into the model—and you can read about them in the Introducing PADDLIN’ article—but in practice how the pieces fit together and what they combine to build is always a little bit new even to the modeler.
I want to know why my own eyes—as well as my own reading of the data in less structured ways—are leading me away from the model and what goes into its determinations and why they are different.
What I found is that to grasp the differences, I have to look deeper than the more obvious modeling decisions that made PADDLIN’ stand out. Rather it was a series of broadly defensible modeling choices adding up, over time, to results I do not entirely agree with. And it makes me think about new ways to continue to refine these models to produce slightly more intuitive results.2
The Obvious Explanations: xG and Player Value
The biggest decisions that set PADDLIN’ apart from most models are the incorporation of advanced statistics, including xG, where available to evaluate international teams, and the inclusion of Transfermarkt data to supplement those evaluations with player value estimates. It would have made sense if those distinct components were the primary drivers of these findings, but they are not. In fact, the addition of xG and Transfermarkt value significantly boosts the European teams in relation to Argentina. The gaps between Spain, France and England appear to be primarily driven by the results lens in the model.
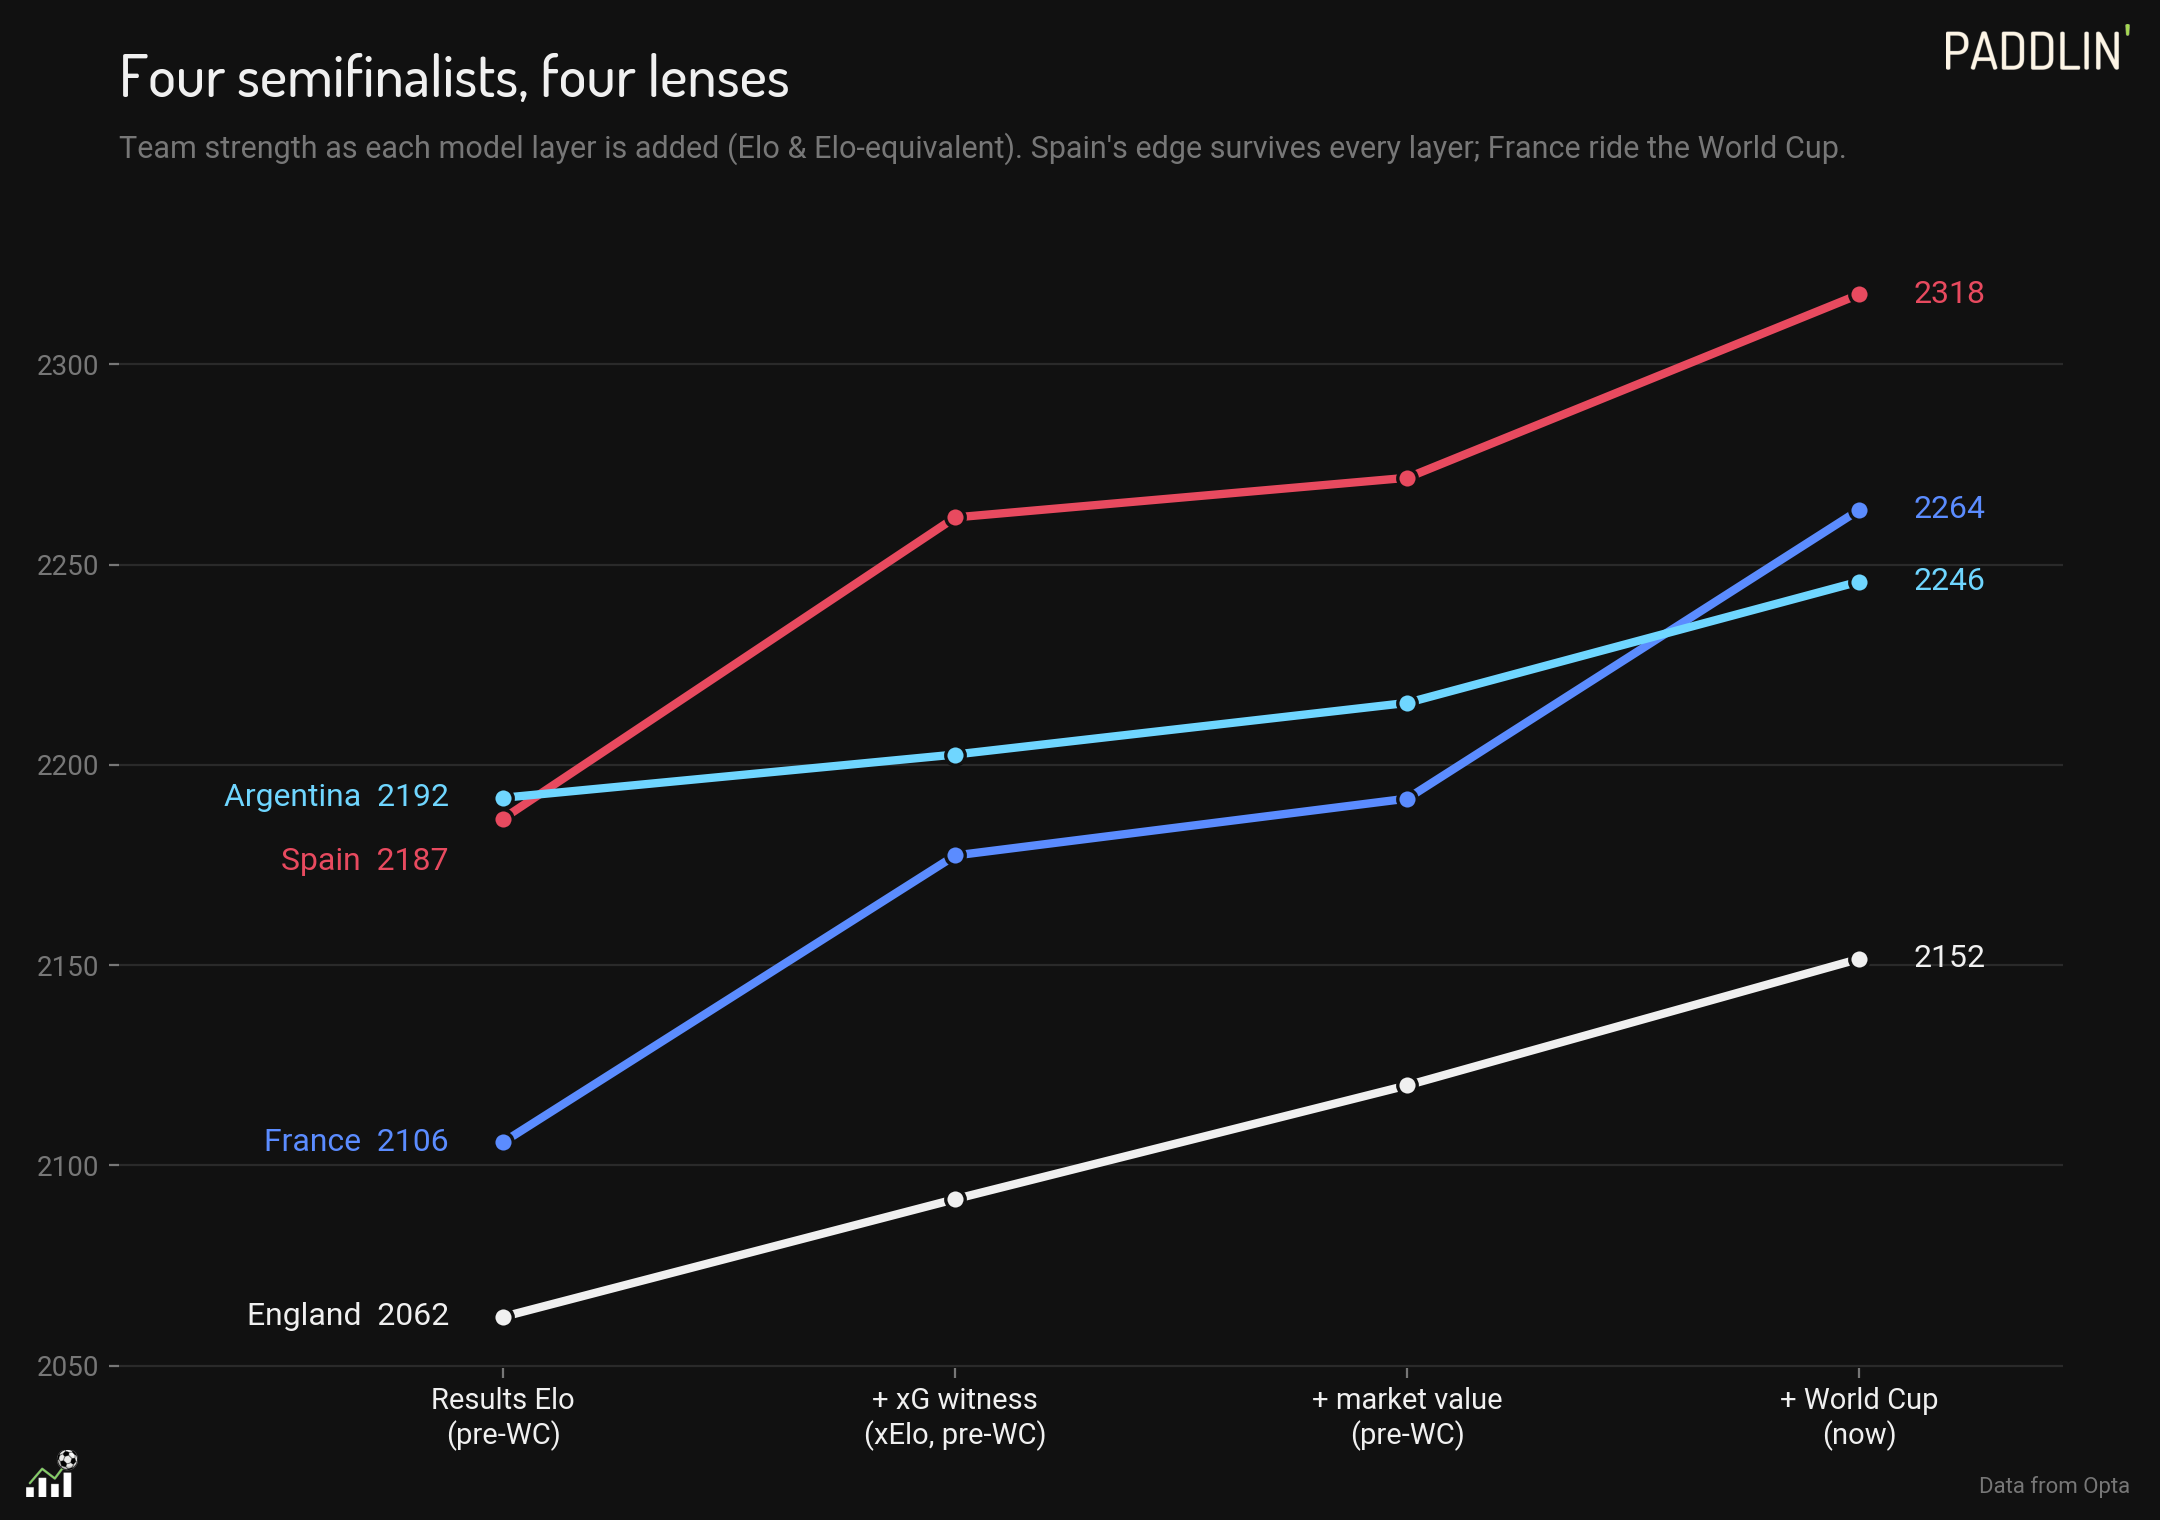
Both Spain and France gained a bit more from the addition of xG and Transfermarkt data than England did (plus-86 and plus-85 for Spain and France, compared to plus-58 and plus-24 for England and Argentina. The larger effect here is that Spain’s and France’s performances at the tournament itself have pushed them further ahead while France have gained somewhat on the model’s favorites.
It is not a case where expected goals provide a massively different signal, or where the Transfermarkt values shifted anything too notably. So to find the gaps we need to look more granularly at exactly which results mattered, and how. With Spain and France, those differences are somewhat harder to explain and remain more equivocal. With Argentina and England, I can see what the model is doing and I can state my disagreements more clearly.
