

Building Marcel, Part II: Age Curves
In which we begin to grapple with the final boss of soccer analytics, context adjustments.

The age curve is one of the founding concepts of sports analytics. Anyone can observe that the vast majority of professional athletes are young adults. But the consequence of this fact, that clubs and managers should expect their players to decline as they pass their peak athletic age, has always been hard to apply. Different skills decline faster with age, while others may even improve over a player’s career. And of course, every person ages differently. Time comes for us all, but time may come for Kevin Lasagna at 26, while Mohamed Salah continues seemingly unaffected well into his 30s.
The project I began in a previous newsletter, a “Marcel the Monkey” system for player projections in soccer, offers one way to get more clarity on what the age curve means. The most basic statistical projection system would take a regressed, weighted average of past performance, then adjust it for context effects and for aging, and provide a simple baseline expectation of player production in the next season. The previous study looked at different methods of regression and weighting for different statistics. I can use those results to aggregate players’ expected levels of performance and compare it to real performance at different ages, in order to gain a more fine-grained understanding of aging in soccer and to begin identifying the aging paths for different skills rather than for a player as a whole.
Age Curves By Position
Much existing work on aging has already approached this topic by narrowing in on age curves by position. I wrote about this a decade ago,1 and a recent study by Tom Worville at The Athletic broadly confirmed these findings. Both studies are based on the idea that total minutes played offers a useful proxy for the age curve. Assuming that clubs and coaches make decisions at least somewhat rationally, choosing the best players they have available to play, the players getting first-team minutes in top leagues should offer a reasonable sample of the best players available.
So who plays those minutes? While there are differences by position, a clear pattern emerges of minutes played by age peaking between 23 and 28 years old.2
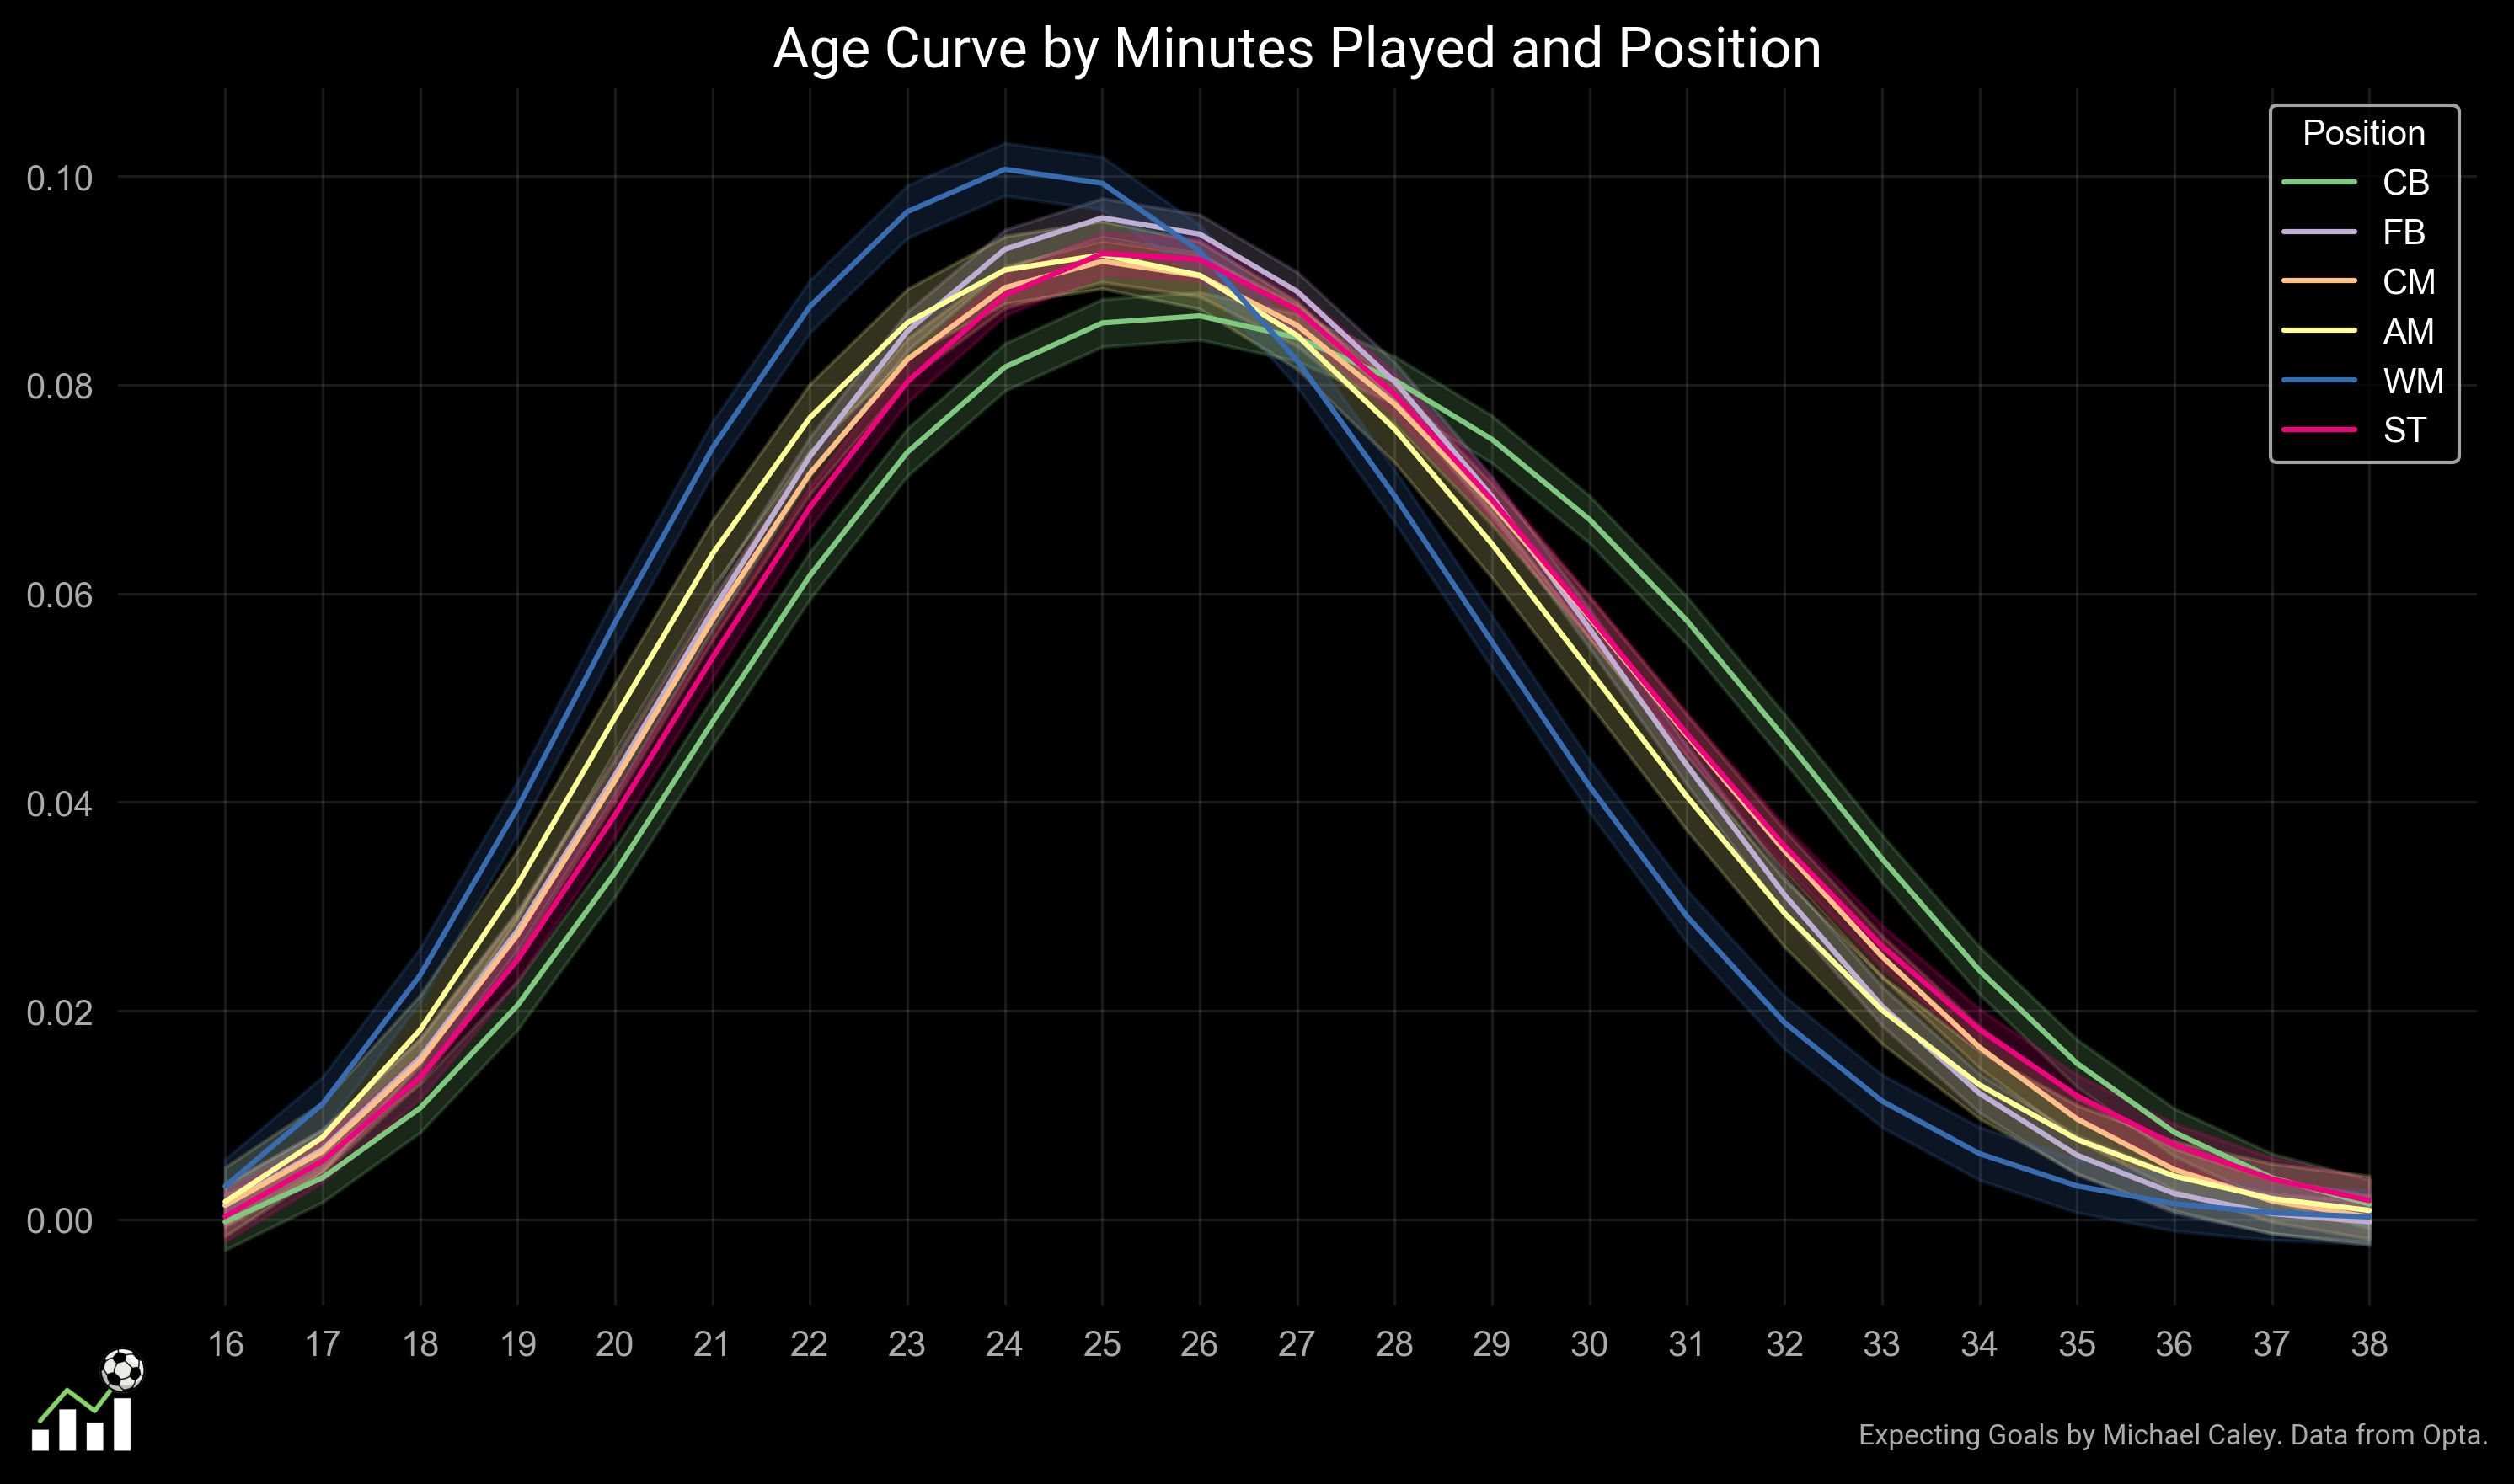
This graph shows the results of a Generalized Additive Model3 applied to total minutes played by age and position in the big five European leagues since the 2010-11 season.
What stands out, beyond the fact that decline clearly begins at most positions before players turn 30, are the distinct curves for wingers and center-backs. Wingers peak a year or two before most players. Teenagers are more common in wide attacking positions than elsewhere, while players over 28 are rare in those roles. The peak is more concentrated, higher than all other positions, and earlier. Center back, by contrast, has the longest peak running from about 23-30 and declining much slower.4
It’s easy to offer hypotheses to explain this based on the structure of football. Wide attackers have to do the most running, and in particular the most sprinting and quick accelerating of all players on the field, and their value is the most closely tied to those fast-twitch athletic skills. Center backs, by contrast, have to cover less ground and depend less on speed and acceleration than players at other positions.
But then why do all the other positions, which also demand different and varied skills, mostly just bunch up in the same curve?
Part of the answer here is that further distinctions can be found at the very extremes of these curves.
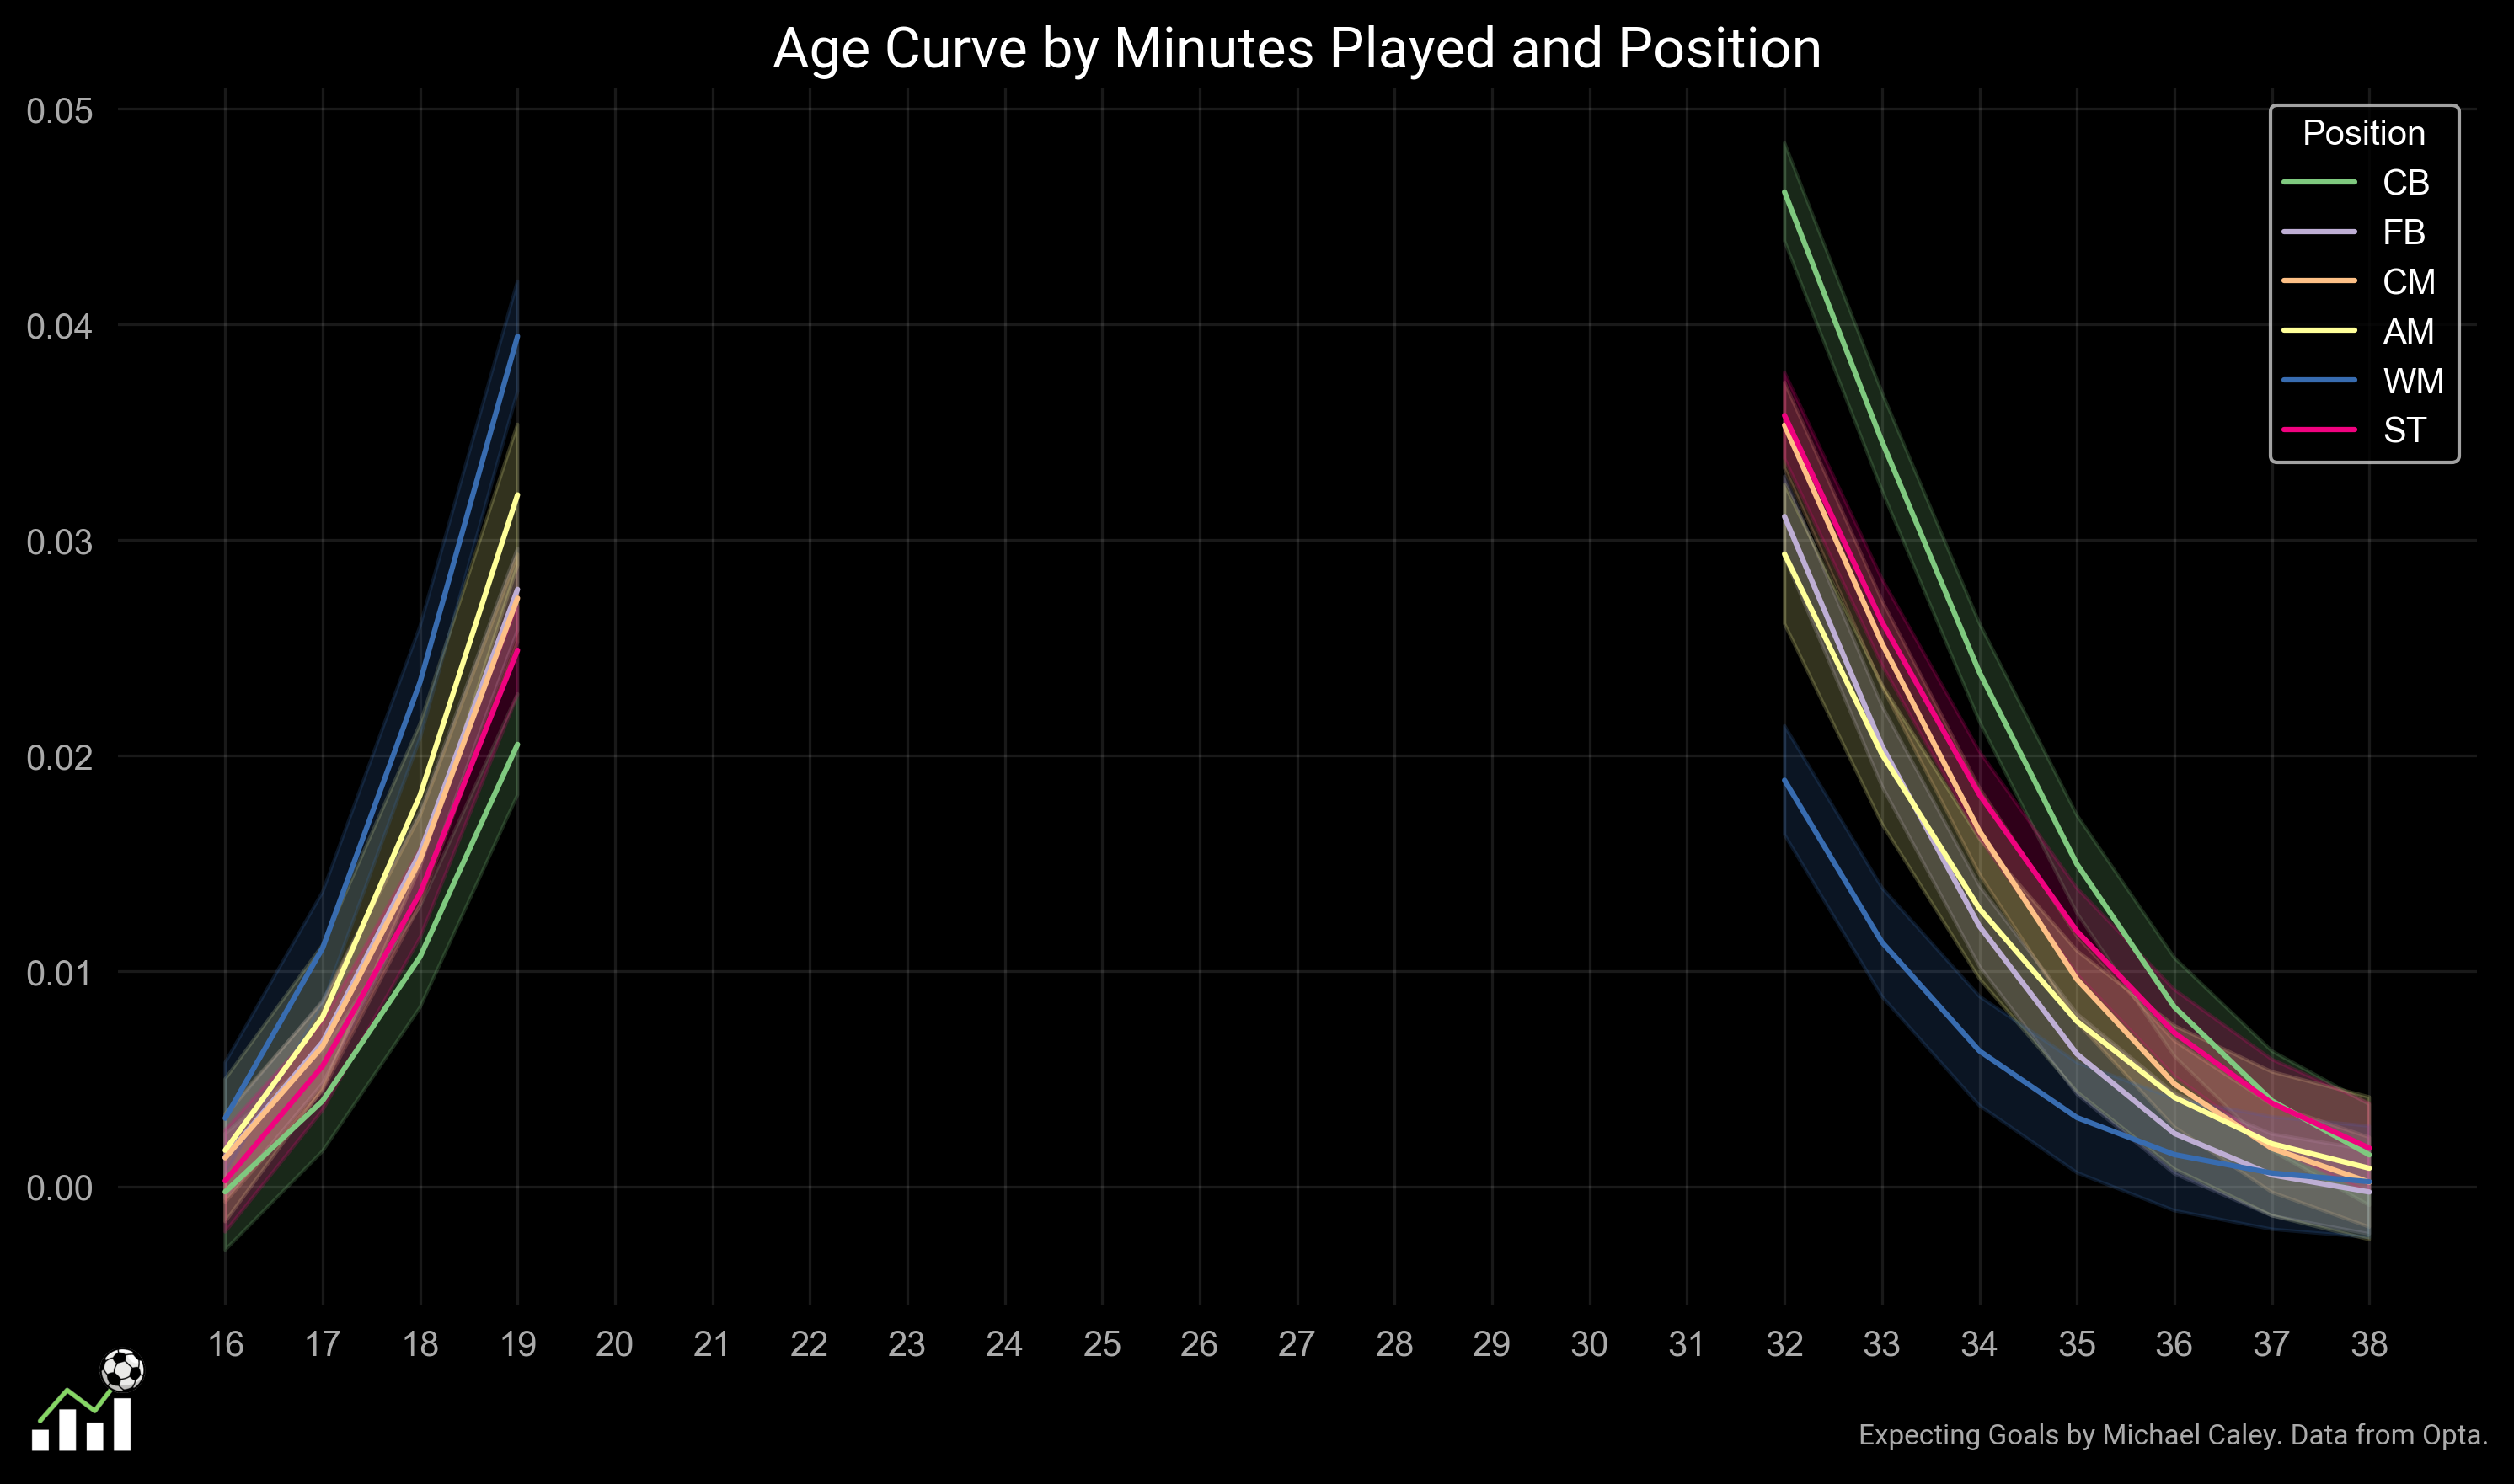
Strikers become overrepresented in the player pool in their mid-30s, while fullbacks disappear from the player pool at the same time. Central attacking midfielders make up a significant percentage of minutes played both among very young players and also among older players.
The striker and AM effects point to the importance of disaggregating skills. The strikers who maintain their level into their 30s tend to be penalty box finishers, who can provide value with their understanding of space and their strength. Likewise early career attacking midfielders tend to have much more winger-like skills and while those later in their careers tend to be more exclusively passers. My hypothesis is that the reason the curves for FB, CM, AM and ST overlap each other so much is that there are many different ways to play these positions and so certain skills associated with young players will predominate at one time and other skills associated with older players will predominate at other times. Using position as a proxy for the complexity of player aging does offer some insights but it is not fine-grained enough to get into a number of important issues.
This study offers a deeper view into soccer player aging and the effects on players statistics than can be found just by looking at age and minutes. I have modeled aging tendencies over many of the key, modern on-ball statistical metrics, and this newsletter will present and reflect on those model results.
Aging Curves for Statistics
The modeling process here is ultimately similar to what created the first set of age curves, and so the graphics will look similar as well.
If you prefer to see the results of a study rather than read through its technical method, feel free right now to scroll down to “Shot Statistics” where I will begin to talk through all the results.
The process begins with the 2-1-1-5 regressed average for statistics that I found was the overall best method of predicting future performance. I created a projected per-96 statistical projection by taking a weighted average of total production, in which the most recent season has double weight (2), the two preceding seasons have single weight (1). This weighted average was regressed by adding to it 480 minutes (5 full matches of 96 minutes) of league average production for players at the same position.
By aggregating every player where it’s possible to create a regressed, weighted average of past production and comparing that projecting to the player’s real production in the following season, it is possible to search for patterns by age. This is done again with a Generalized Additive Model based on projected production, real production, and age. Are players more likely to decline or to improve on their projected levels in a particular statistic at age 24, age 25, and so on?
The underlying results of the GAM only show year-to-year change and, for instance, look like this for shots attempted.
These are then extrapolated into a curve to make the results easier to interpret, showing peaks based on when players cease improving and begin declining.
These extrapolated aging curve graphs, then, chart the yearly tendency for players to improve or decline in a certain statistic, linked together to create a graph scaled to average player production across the whole population. Average player production is represented by the dashed line. The standard decision of the model is represented by the shaded area, with larger error bars visible earlier and later in players’ careers where the samples are smaller and noisier.
Most of the results are reasonably intuitive, but there are a number that require deeper consideration and several that we may puzzle over together. I will start with the most basic statistics: shots, goals, and expected goal, and then continue to look at statistics for ball-carrying and receiving, for defensive ball-winning, and finally passing and touch location.
Shot Statistics
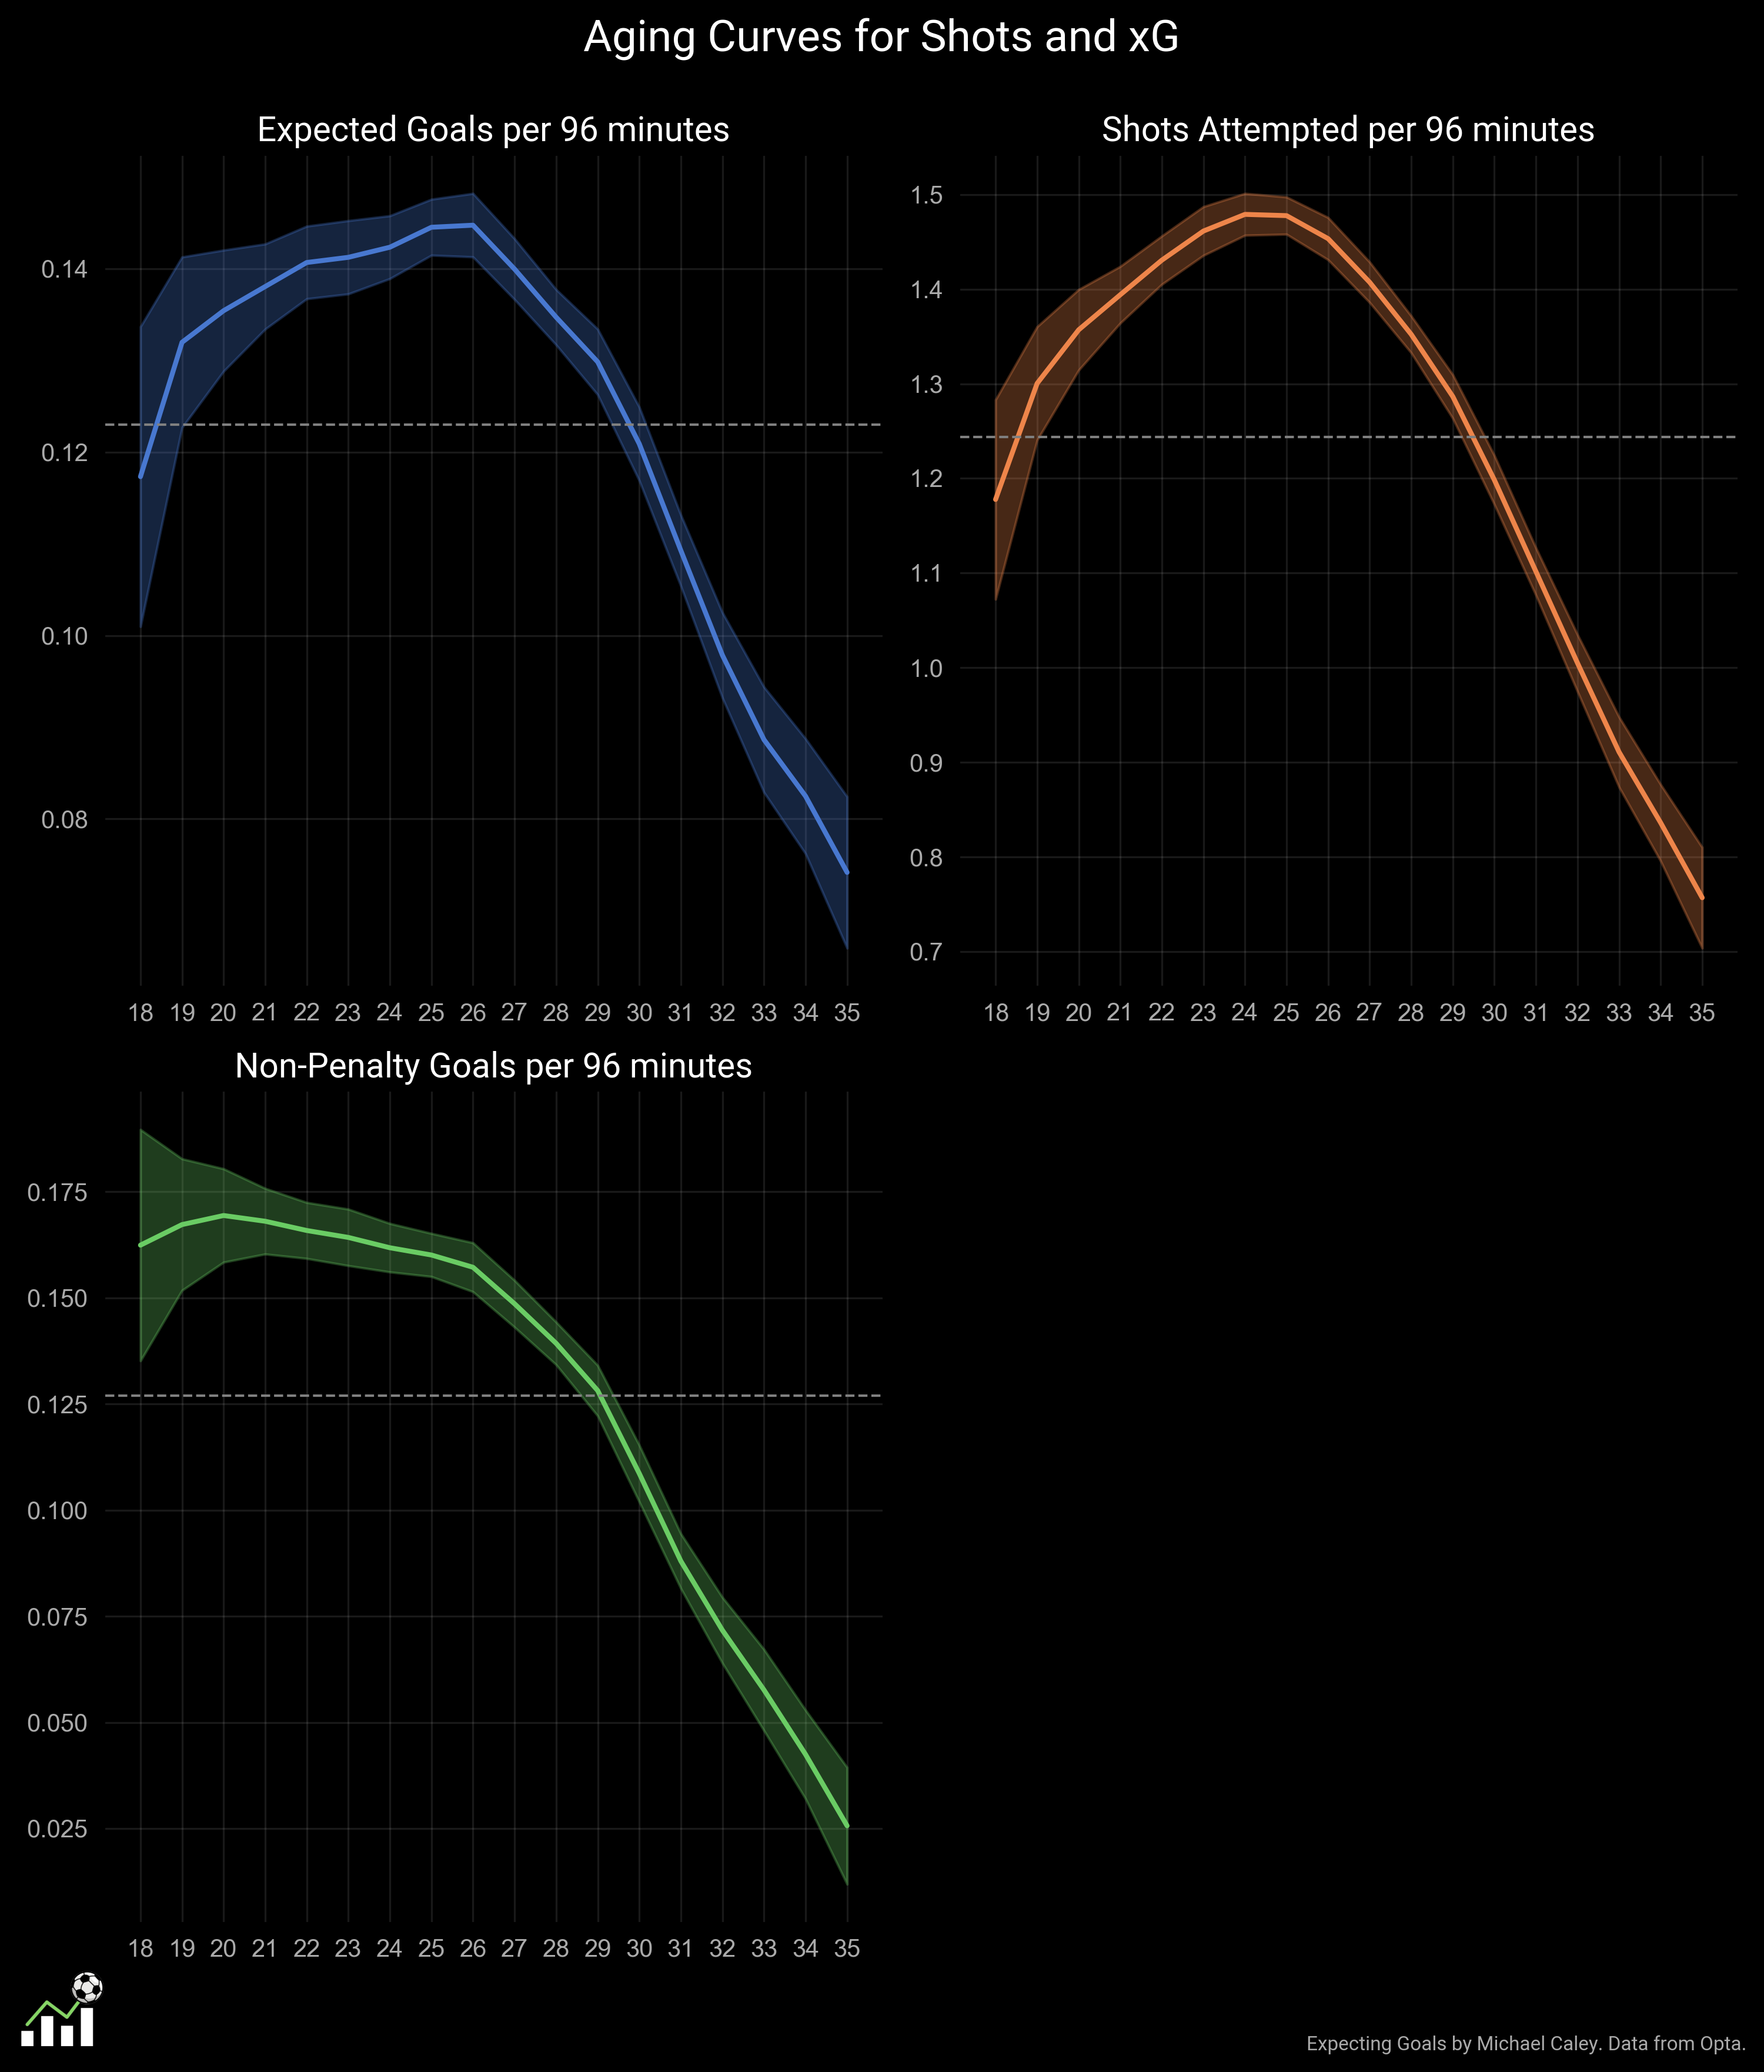
Shot attempts and xG track each other pretty clearly without significant apparent difference in xG per shot over a player's career. The peak runs pretty early, between about 22 and 27. There is a slight tendency for xG to peak later than shots, but only by about one year.
The non-penalty goals graph is undoubtedly puzzling. Why do goals not show the same early improvement curve and then decline a little more slowly than shots and xG?
