


This newsletter is co-written with Joel Wertheimer, a civil rights attorney who writes the Wertwhile Newsletter. Joel is also a friend and, even more pertinently, the Double Pivot Podcast’s Official Salacious Gossip Correspondent.
The 2026 election brought about a blue tsunami and a flood of Democratic victories up and down the ballot, all across the country (except for Florida). A race is now on to understand this result: how did Democrats win by so much and how were the polls so far off? Which previously Republican voters were convinced to cross party lines and who just stayed home? Who turned out to vote who had not before? These are topics for the next newsletter.
Today, we will ask the most important question of all: was the Expecting Goals model correct?
And then we will ask the most terrifying question to put forward in online progressive circles: was there an electoral penalty for running as a liberal rather than as a moderate in 2026?
Ideology-Affiliation Scores and the Caley-Wertheimer Elections Model
Before the election, we published “What Kinds of Candidates Win Elections?” and introduced Ideology-Affiliation Scores and same-precinct WAR. We wanted to build a model to capture some of the real ways that ideology is expressed by politicians and recognized by voters. How do candidates present themselves as more progressive or conservative or moderate? And then, of course, does there appear to be any electoral benefit to moderate presentation?
To find ideology, we started with affiliation. This idea follows Lilliana Mason’s argument that in contemporary America, ideology functions through group membership and strongly felt identity, as people line themselves up via a “social sorting” process.1 So we trained language models and decision models, using the campaigns’ own words from websites and ads, to identify which candidates sounded most like members of different caucuses in the House of Representatives. We decomposed from their similarity scores a spectrum of affiliation. Candidates who sound more like members of the Progressive Caucus score as more to the flank of the Democratic Party, candidates who sound more like members of the Blue Dog Caucus score as more to the moderate wing of the party. And likewise for Republicans, with their Freedom Caucus and their Main Street Republicans Caucus.
As a refresher, to find WAR, we are comparing candidates within the same precinct. There is no measurement of swings from 2024. If Joel and Michael are both candidates statewide in New York and have the same amount of money and neither is an incumbent and Michael wins a precinct 75-25 and Joel wins 74-26, then Michael has a WAR of 2 over Joel in that precinct,2 and the model adds all precincts where they share a ballot up to measure that difference. And then it compares them to all the other candidates on the ballot as well, from the state legislative level all the way up to the federal and statewide. This WAR does make necessary adjustments for incumbency, fundraising differences, and downballot leans in states where one party has a tendency to perform much differently in state legislative elections but this is largely an apples-to-apples comparison.
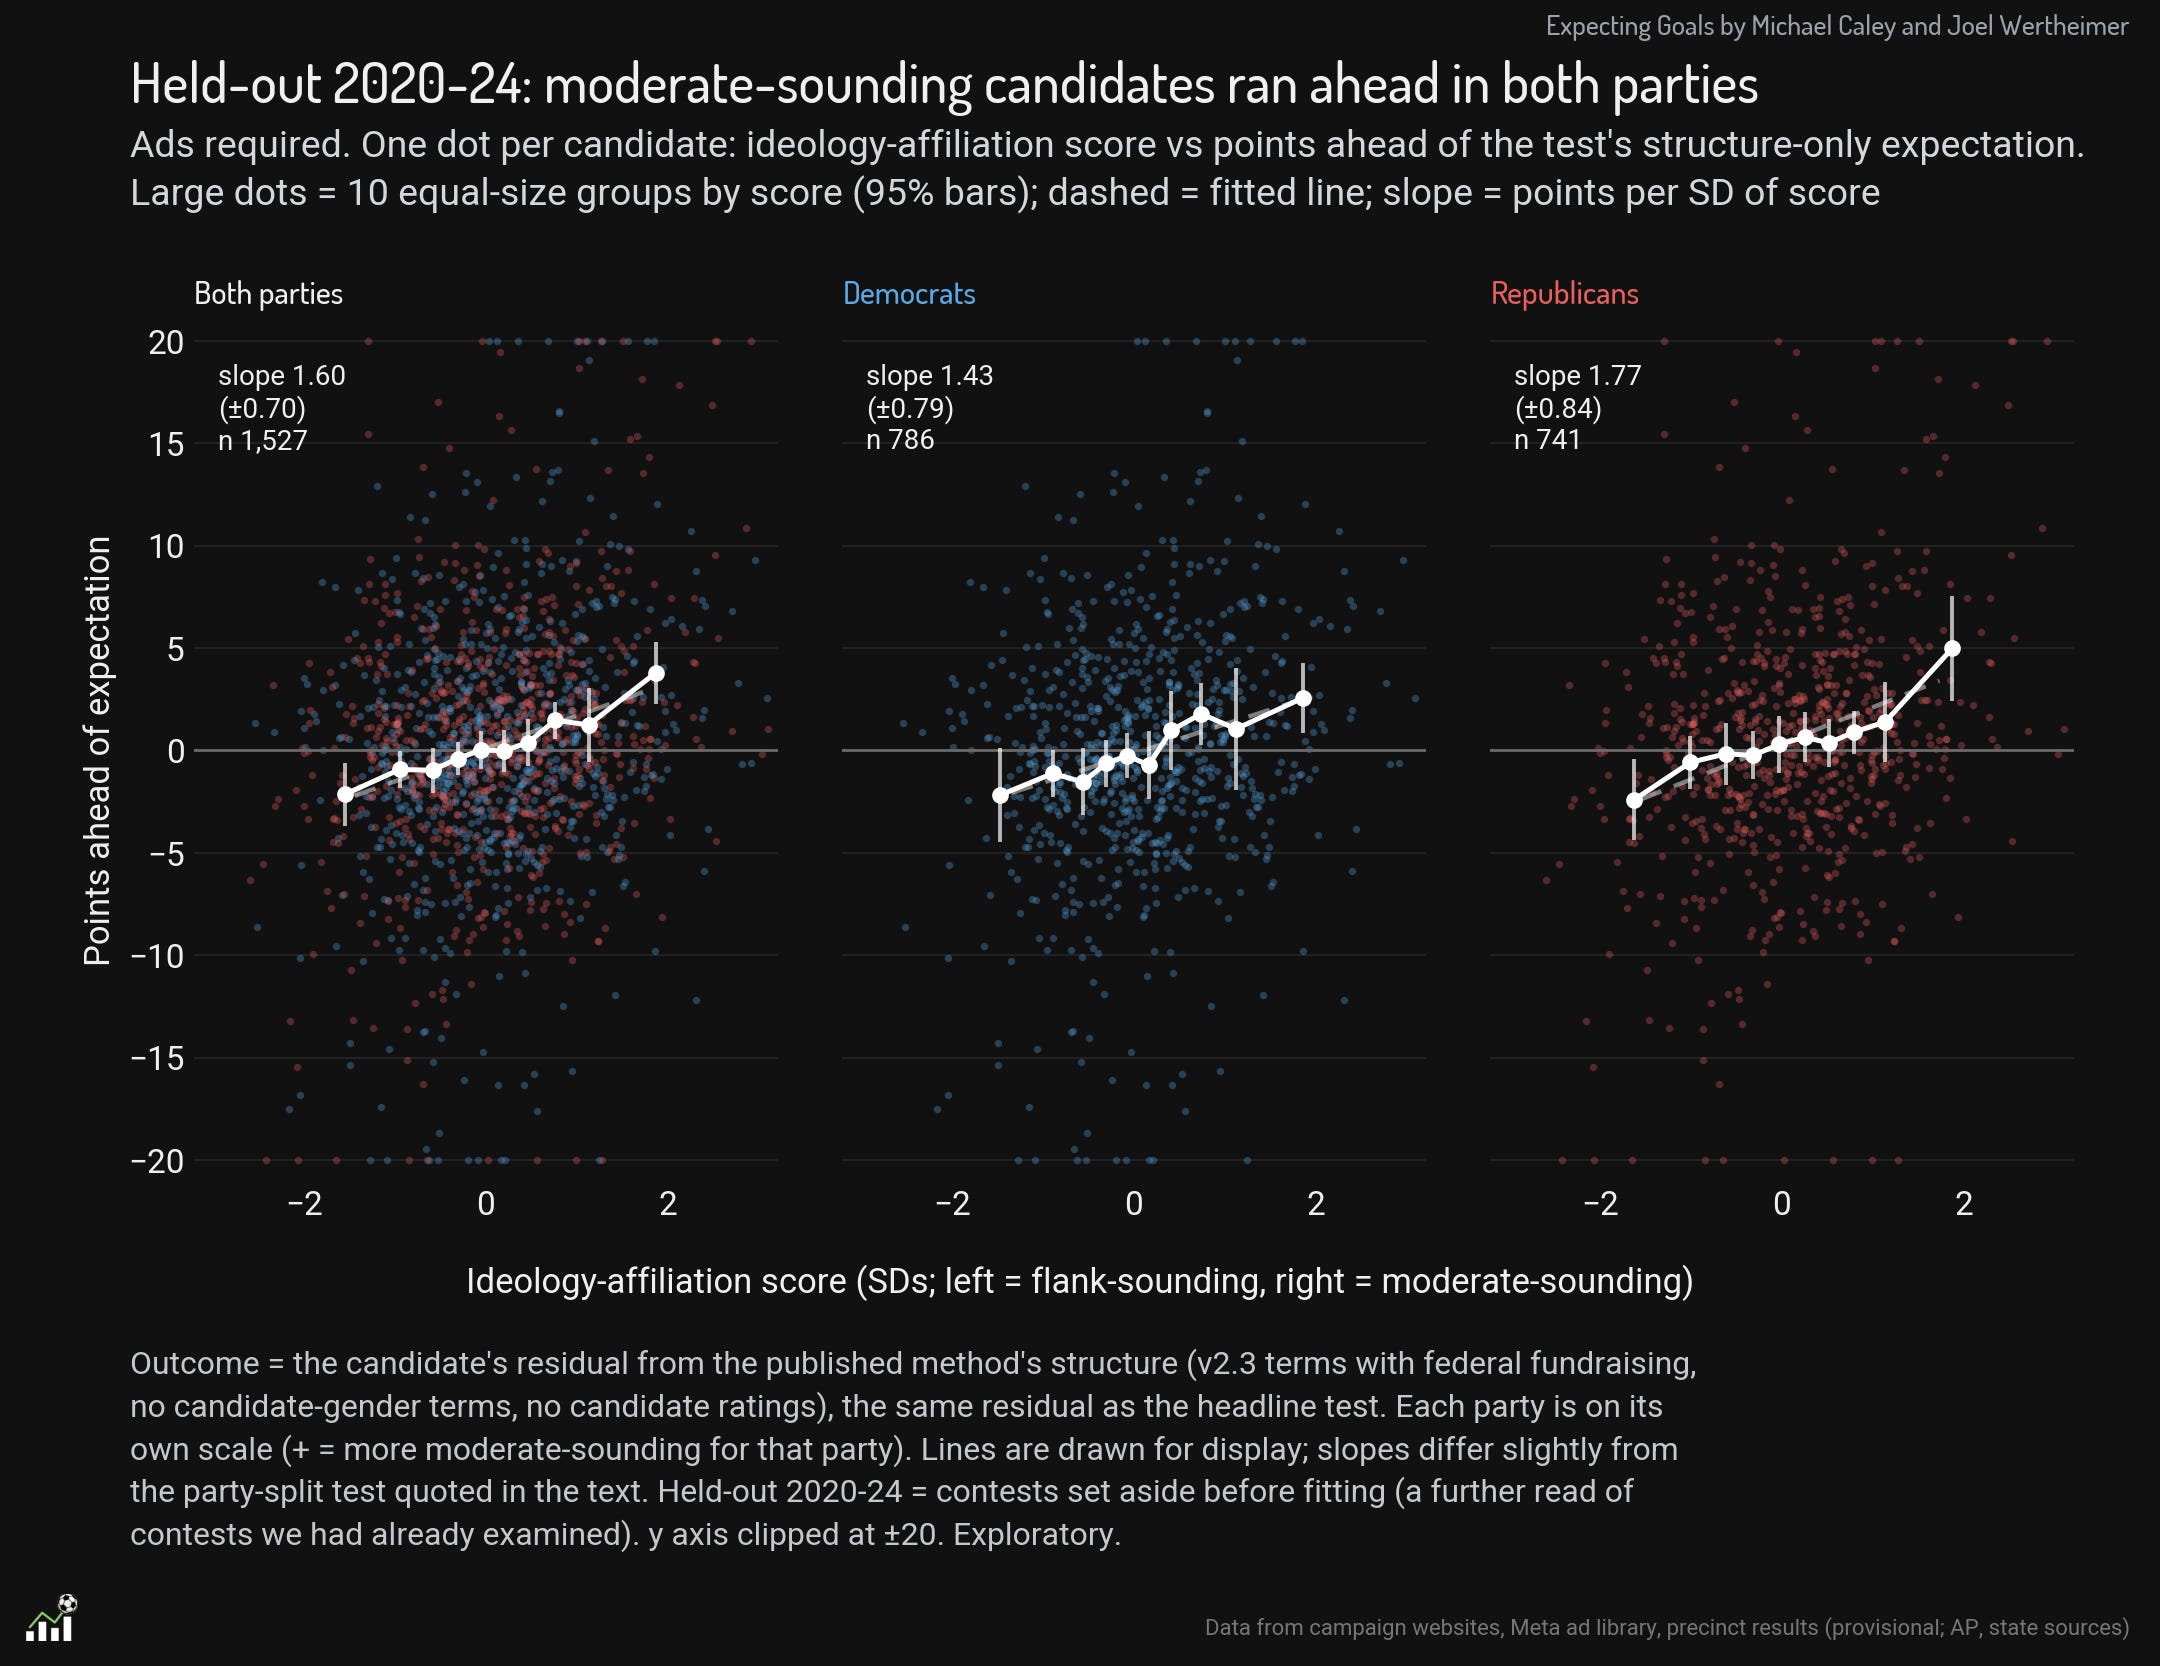
We found that candidates who sounded more moderate in their websites and ads typically ran several points ahead of candidates who sounded more progressive or more conservative. We both would rather that this not be the case in American politics, but the results were clear. All else being equal, more moderate-presenting candidates do better in elections.
Please see the Election Day newsletter for a complete explanation of why you shouldn’t yell at us about this.
2026 Test Results: <celebration emoji>
We published our model on Election Day. This may not have been optimal from an engagement standpoint, but we had a good reason. Publishing the model before the 2026 election turned the election itself into an out-of-sample test to validate our results and we both felt that precommiting is intellectually honest in a debate that requires it.
It passed.
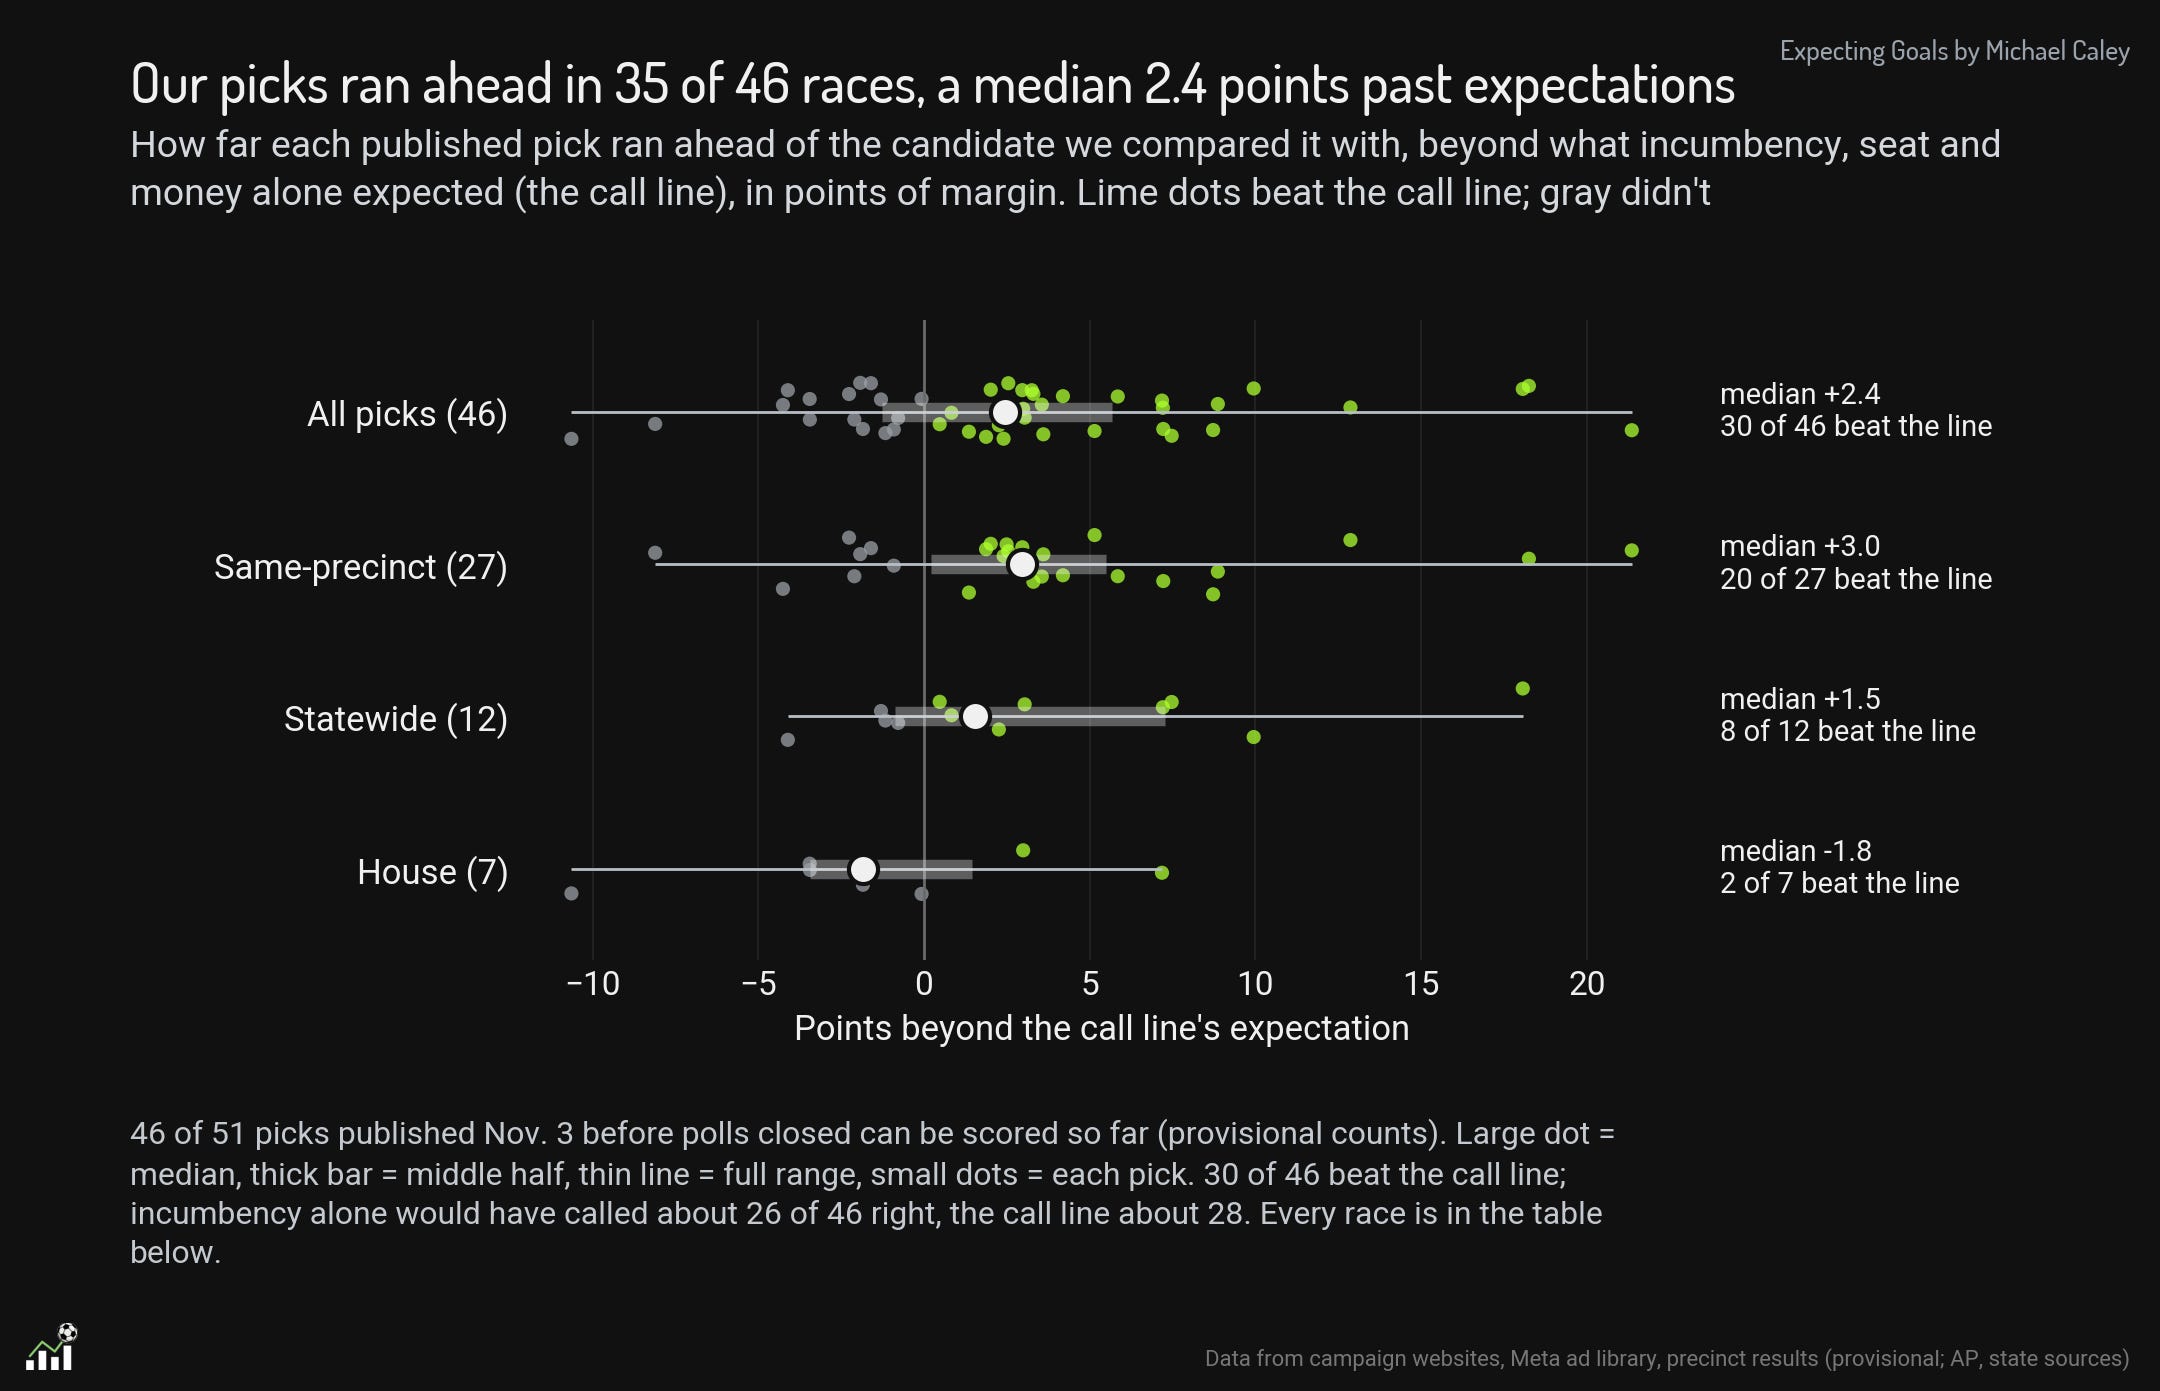
There were two tests. There is the full 2026 statistical test, rebuilding the model using 2026 election results to evaluate whether Ideology-Affiliation Score predicts how well candidates will perform. More straightforwardly, in the initial post we published 51 predictions of specific elections where Ideology-Affiliation Score implied that one candidate would do better than the other.
Of 51 races, 46 have reported sufficiently detailed results to evaluate. Of those, 35 went the way we predicted, for a 76 percent hit rate pending the five remaining races.
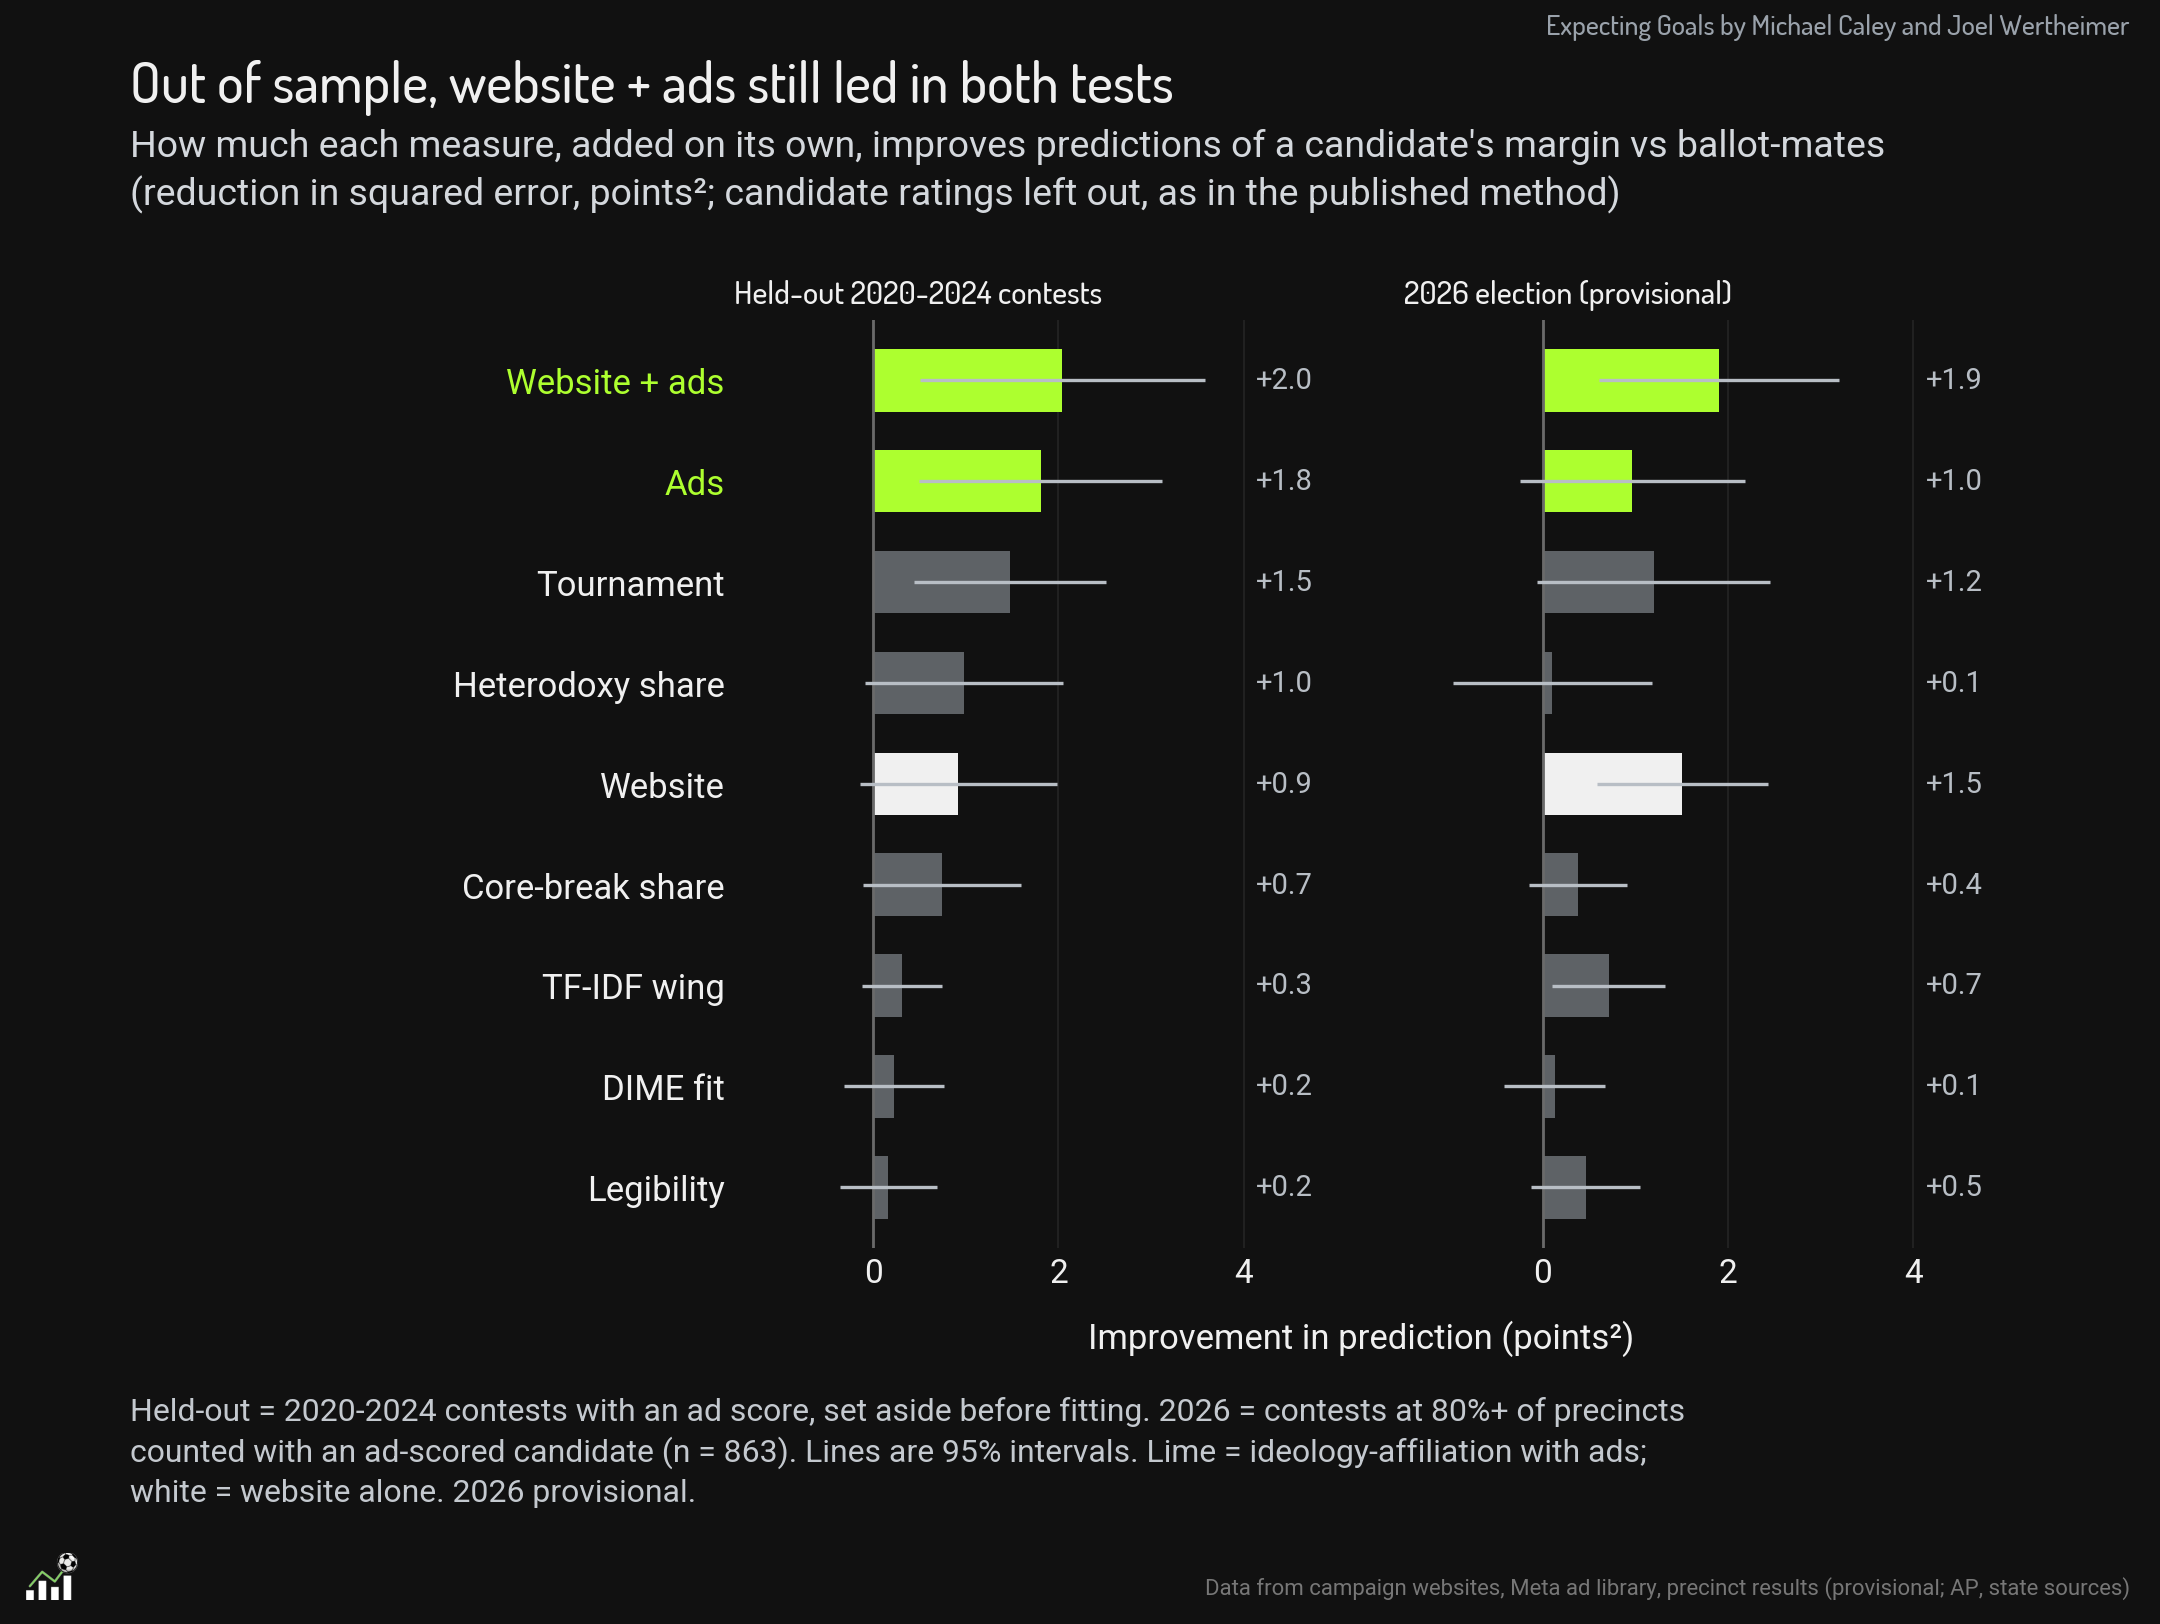
Second, there is the broader statistical test. The published Ideology-Affiliation Score, combining both ads and website text, outperformed our other estimates in predicting how candidates would do, and its estimates beat a “z>2” test, meaning its results were more than two standard deviations from pure randomness. We set up an out-of-sample test in the previous newsletter, risked it all on one election, and the model passed.
For the true sickos, there is an appendix on the results below, a few specific caveats on the model’s success and our initial blog.3
Did Ideology Matter Less in 2026?
Despite the positive statistical tests, we found a more attenuated relationship between candidate performance and Ideology-Affiliation Score in 2026 than in any of the previous election cycles. Over 2020 to 2024, a typical candidate on the moderate side of their party has outrun a typical candidate from the flank by four or five points, if they were measured about three standard deviations apart in Ideology-Affiliation Score. In 2026, that gap narrowed by almost half.
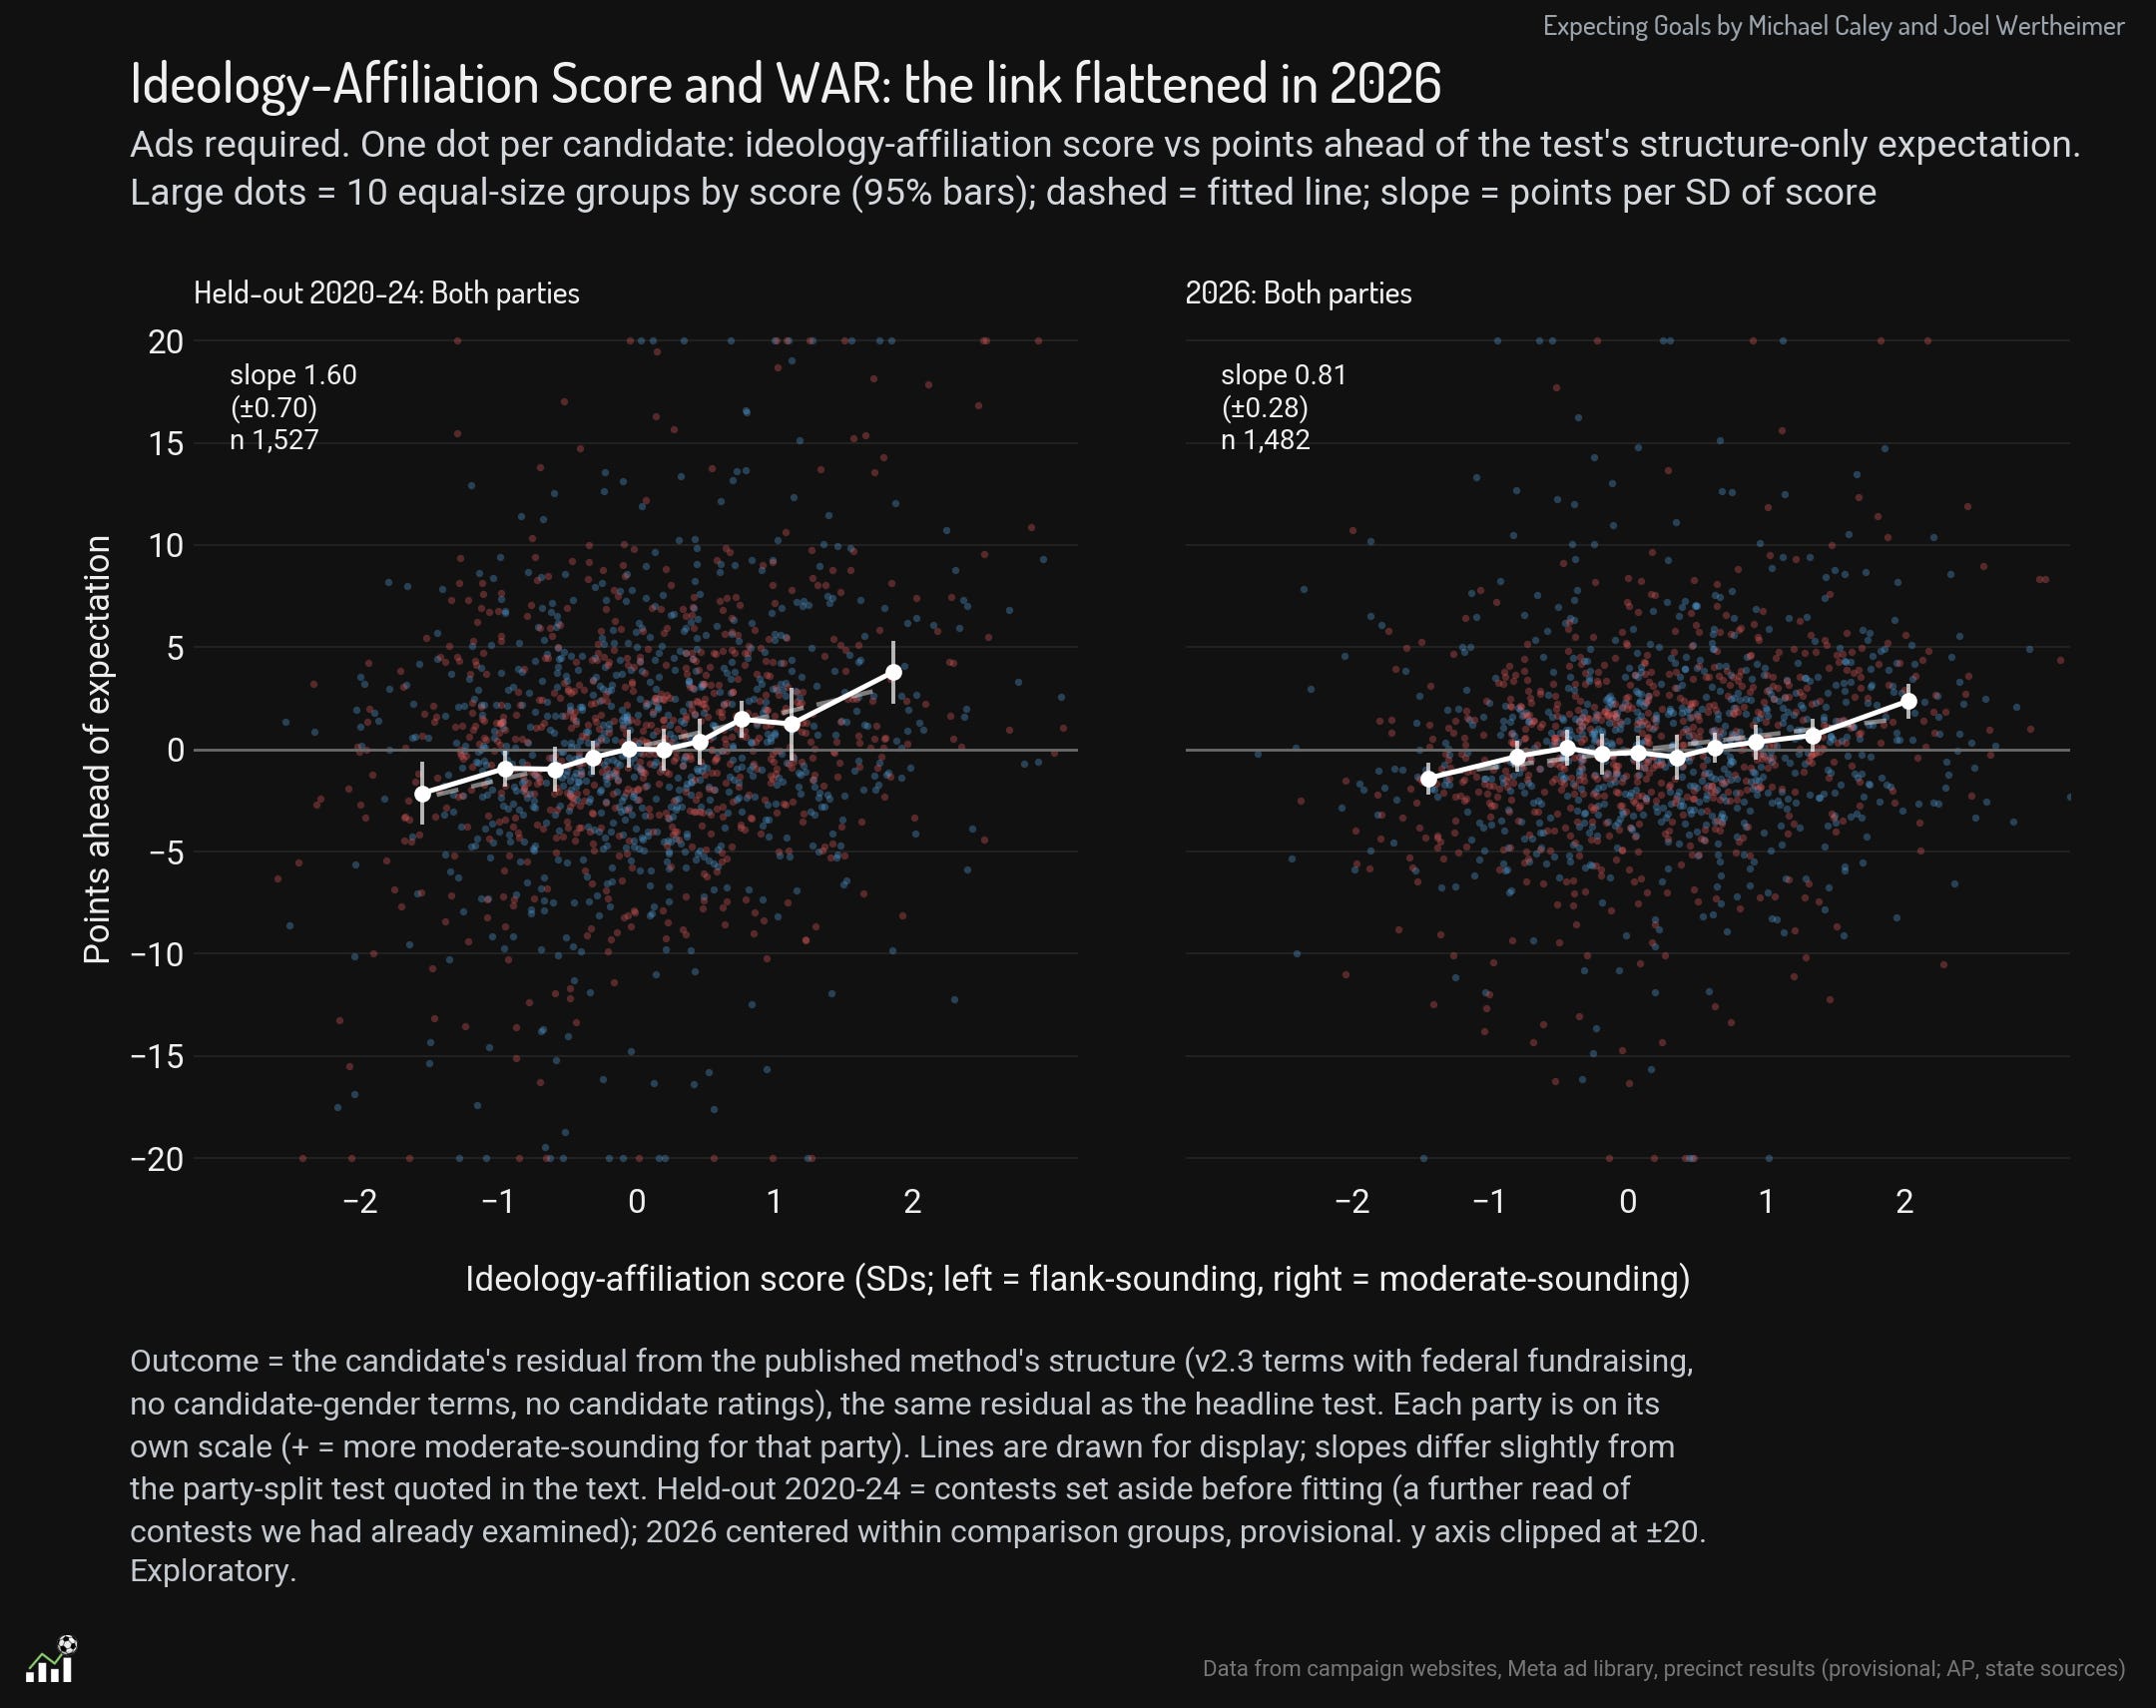
One notable confirmation here is that Lakshya Jain, who has a completely different WAR methodology based on expected performance rather than same-precinct evaluation, also found that the “ideological penalty” was lower in 2026.
When you break it down by party, the differences become even starker. In past elections, there were roughly equivalent effects: taking the same three standard deviations gap, Democrats with notably left-wing presentation typically ran behind more moderate Democrats by about four points, while conservative Republicans underperformed their moderate brethren by about five points. But in 2026, there is a big difference between the parties. The electoral gain associated with moderation appears concentrated among Republicans. Democrats whose presentation leaned left only ran behind Democrats who sounded like Blue Dogs by about one percentage point.
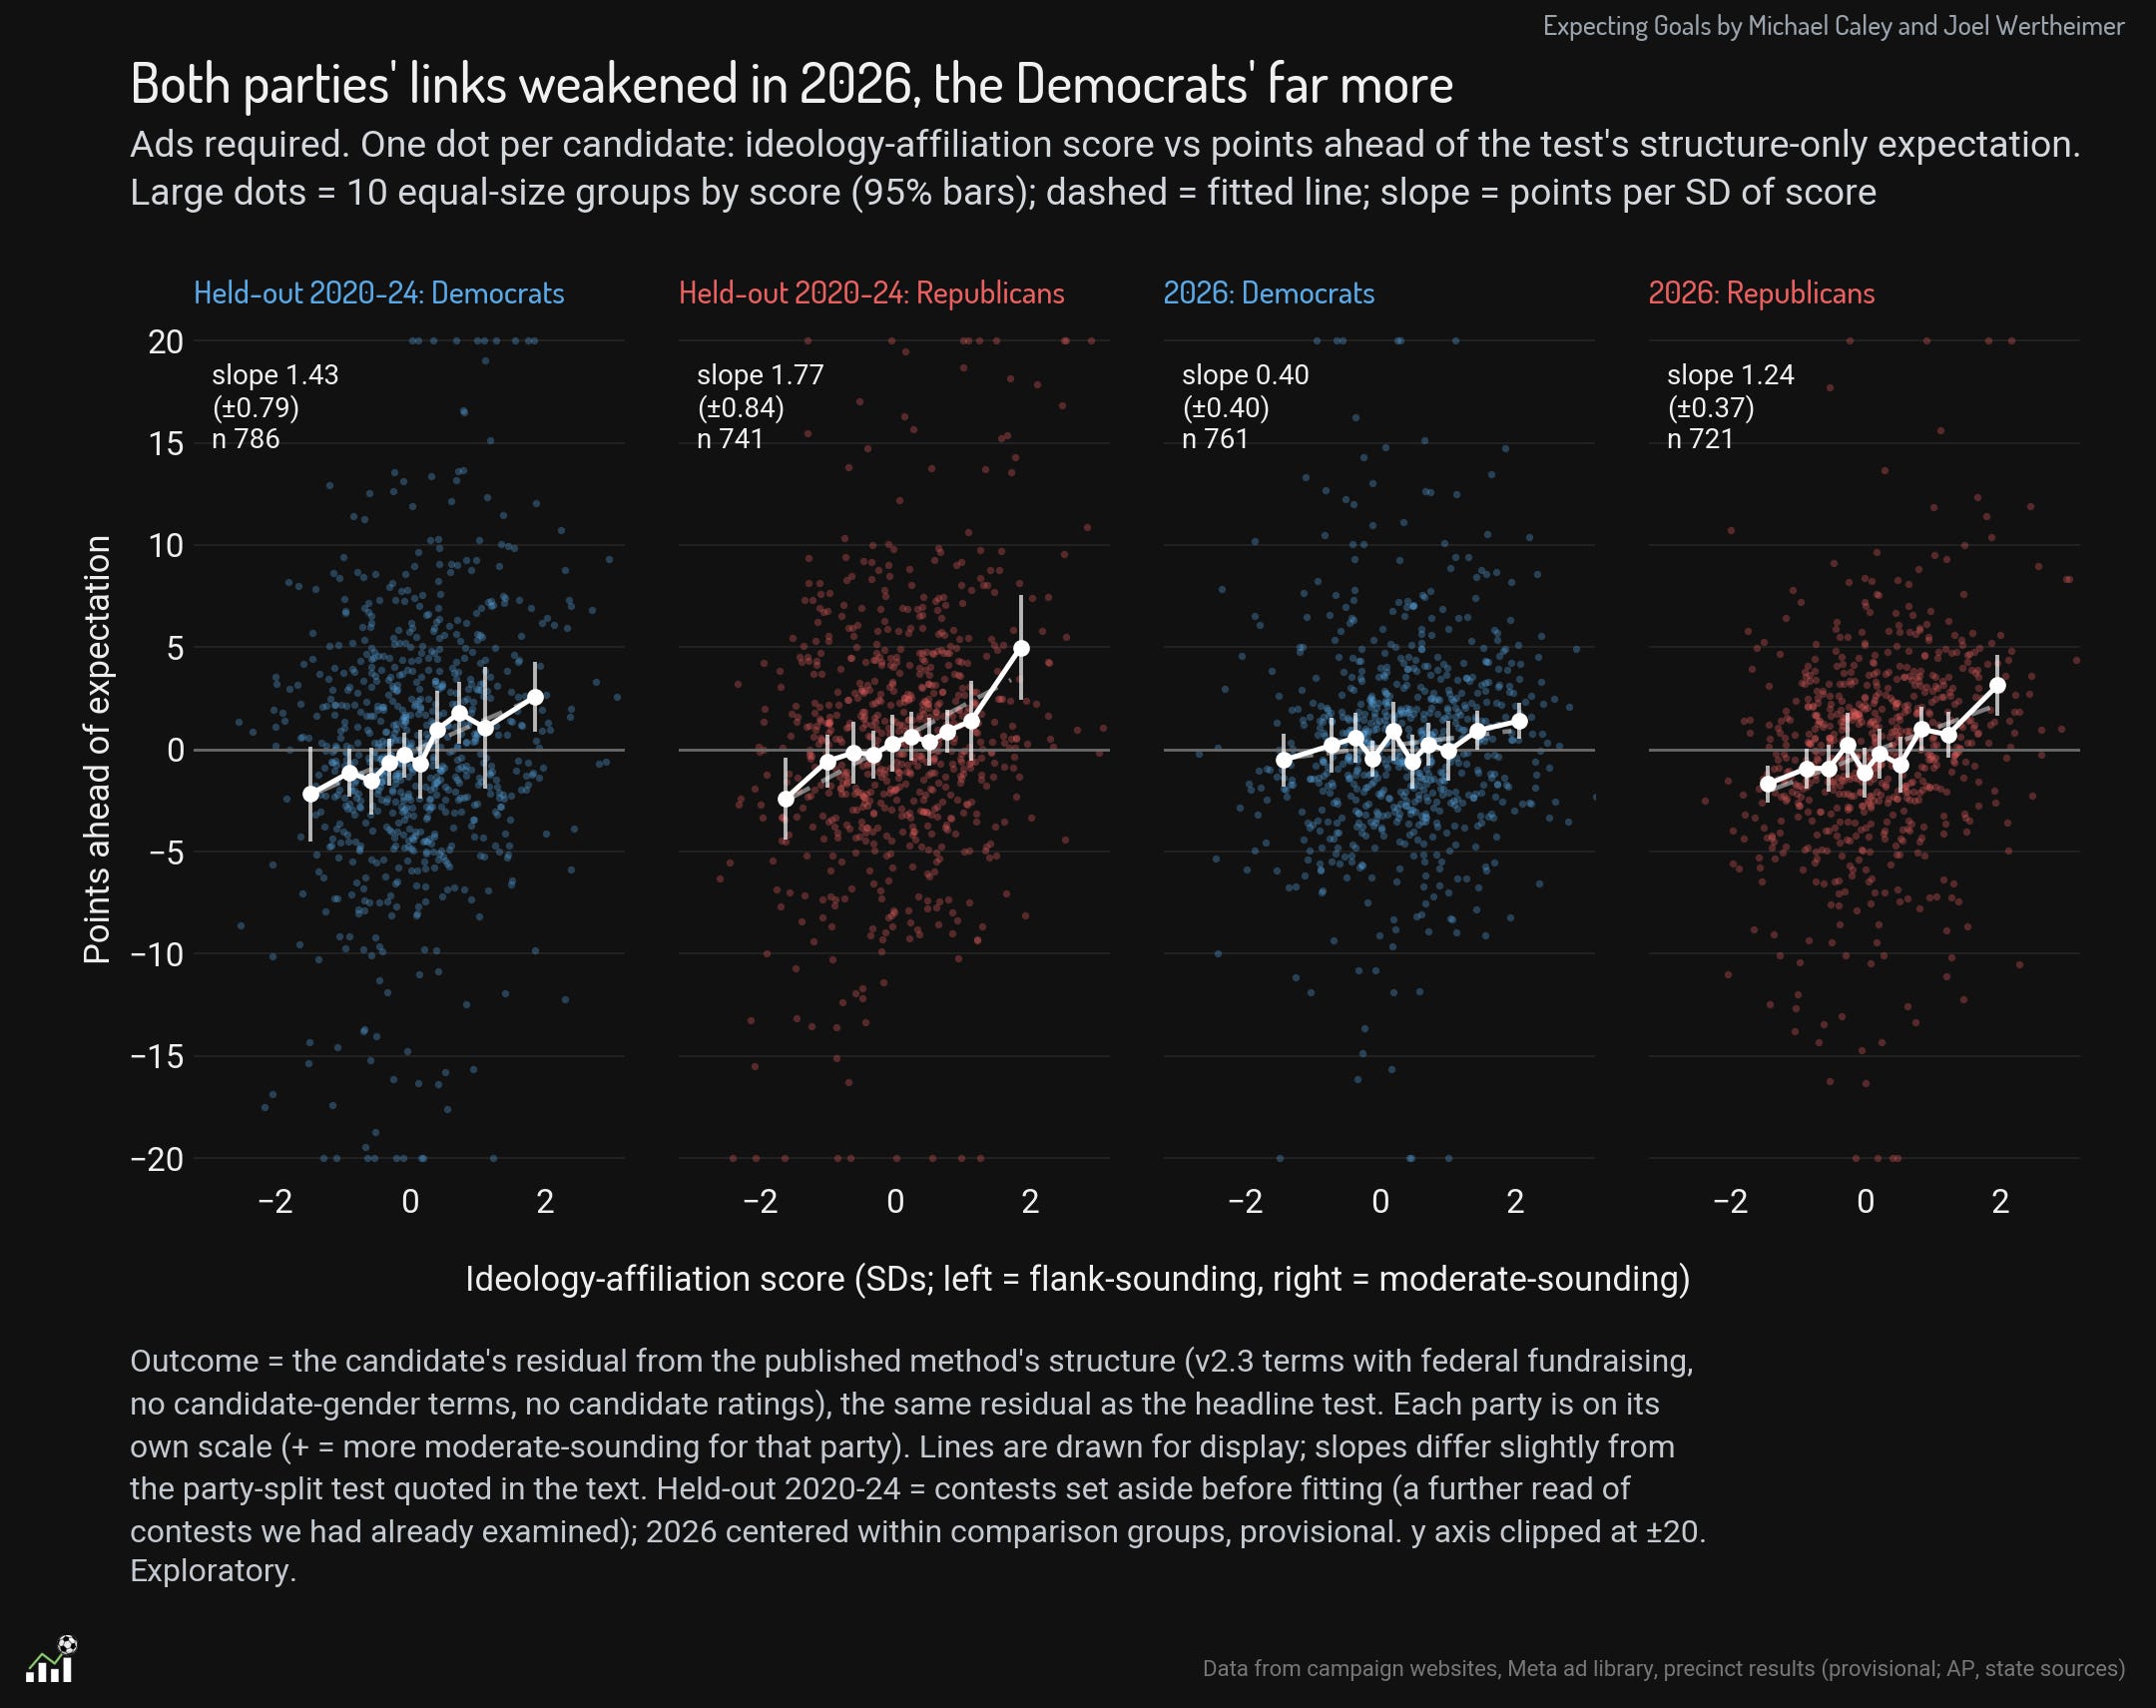
One election cannot obviate the evidence of the last decade that Ideology-Affiliation Scores are associated with stronger electoral performance in both parties. What happened in 2026 is not evidence that progressives never run behind, but rather that in this election, they only ran behind marginally.
But it happened, as far as we can tell. So what happened with Democrats in 2026?