


This newsletter is co-written with Joel Wertheimer, a civil rights attorney who writes the Wertwhile Newsletter. Joel is also a friend and, most pertinently, the Double Pivot Podcast’s Official Salacious Gossip Correspondent. The introduction and WAR sections were written by Michael Caley, and the ideology-affiliation section were written by Joel Wertheimer. We both contributed editing and built the model together.
People in analytics have always believed, broadly, that the same kinds of approaches that work in sports should work on politics too. It is not a coincidence that Nate Silver got his start in baseball analytics.1 Joel and I met online decades ago through a baseball message board, and we have shared an interest in sports and political analytics ever since. We took on this project together because we both felt that recent debates in political analytics—some people call it quantitative political science—have raised fascinating and important questions without quite identifying the right methods to settle the debates or move them forward, and without identifying clearly the scope of the questions being debated.
I refer here, with reasonable amounts of terror at the response this will generate, to the great Ideology Debate. Do moderates win more elections? Do progressives and conservatives win fewer elections? To what degree do candidates’ stated positions on issues and their broad affiliations with particular political movements drive the outcomes of their campaigns, and are there other factors that are more or less important?
Answering these questions quickly lands you among truly knotty questions of analysis. My language in the above paragraph moved from “ideology” to “moderates, progressives, conservatives” and then to “issue positions” and then to “affiliations with movements”. Anyone could point to a politician they consider more of a conservative or more of a progressive, but turning those broad intuitions into an objective measure is one of the hardest questions to answer here, and certainly there is no single definitive method for such classification.2
The other big problem is identifying which candidates win elections. Of course we know, at some point after Election Day, who has won each election. But the most basic insight of sports analytics is that even if you know who won a game, you need to understand its context to understand what the players accomplished. Building a player value model requires identifying how games are won in the sport and the components of wins, and then stripping away as many contextual factors as possible from a player’s statistical record until what is left are those win components in as pure a form as possible. These sorts of models become harder to build the harder it is to break down the statistical components of winning and to distinguish contextual effects from a player’s contributions.3
In politics, the statistical record is as simple as it gets: vote counts and shares. When thousands or even millions of people cast ballots for an individual, you get as good a rating of that individual’s success as you could hope. But, problematically, each person only runs every couple of years, and building a sample is difficult. Further, each race exists in a broader political context that increasingly determines results. Were more of the voters in the district Republicans or Democrats? And we must account for the national climate, the state of the economy and foreign policy, the “vibes” of politics: were those factors more favorable to one party or the other? There are far more Democratic senators from blue states than from red states, and vice versa, and this is obviously not because blue states produce more highly skilled Democratic candidates.4
These are the two big questions we’re going to take on in this newsletter. We have two politician “Wins Above Replacement” (WAR) scores, evaluating how well they have performed in elections, and we have an initial ideology-affiliation score. And we’re going to use this material to make some predictions about elections that are taking place today in the United States.
The Scope of Analysis (Don’t Yell at Us)
One of the reasons that the Ideology Debate has gotten so polarized is that there are real stakes to this debate. People who have strong opinions about whether it would be better to have more progressive governance or more moderate governance would prefer to have more progressive or more moderate politicians in government. And people who have strong partisan opinions about whether it would be better to have more and larger Democratic majorities would prefer to run Democratic candidates who are more likely to win.
(I have moved here from talking more broadly about both sides in politics to talking about progressives and moderates in Democratic politics because this is just the nature of the debate. The Boston Review series linked above is almost entirely Democrats arguing over the relative appeal of progressives and moderates. Republicans should probably also care, but in practice it seems like they care a lot less. Or at least that no matter how much they care, they prefer not to talk about it in public as much.)
Whatever (somewhat different!) ideological preferences Joel and I may have, being right about a reasonably objective issue in analytics matters a lot to us too. And the questions of how to identify winning politicians and how to categorize ideological affiliation are questions that can have a better or a worse answer. We both took this on because we did not think the current methods used to answer the questions in the Ideology Debate were up to the task.
I will say that I am not exactly over the moon about what I found.5 I definitely would prefer it if fewer politicians that I agree with on major issues were toward the bottom of the WAR table and fewer politicians that I share a party with but find exceptionally annoying were toward the top. But getting it right matters to me, and this is what I found. There does appear to be some real electoral benefit to moderation.
Now, this finding itself, which we’ll lay out in much more detail, should be put into context. What materials did we use to identify winning candidates? Election returns adjusted for national and local political environments. What materials did we use to identify ideology and affiliation? The text of candidate websites and paid advertisements, captured in the months leading up to the election. In both cases, everything we looked at covered a timeline of only several months, and was concentrated in the days and weeks leading up to Election Day.
These findings, then, apply with the greatest force to the period in the runup to an election. There is, of course, much more to politics than winning elections. There is governance, the actual wielding of the power won in elections, the entire reason anyone should care about this in the first place. And there is also the work of politics over longer periods of years: building movements, convincing people of major questions of right, and so on. These findings do not really weigh in on those questions. And this study cannot address more abstract but no less important debates about whether a choice that can help win an election is morally justifiable or not. But the findings do suggest that during an election season, for those months out of the year, candidates with more progressive or more conservative presentations to voters tend to perform somewhat less well.
Ok. That’s enough throat-clearing, and surely we have now established that no one should yell at us about this newsletter. In the next two sections, I am going to introduce the WAR system and then Joel is going to introduce the ideology-affiliation system, and then we will have a few final notes and some 2026 election predictions.
Introducing WAR (and WAR-E)
There are two ways to approach evaluating how well a candidate has performed in past elections. One is to attempt to adjust election results for context: the national environment, the statewide environment, underlying demographic trends, incumbency, how much money the candidates were able to raise, whether the voters in the district are more or less open to voting for a candidate from the other party, and so on. This is broadly the approach used by Lakshya Jain in building the Split-Ticket WAR system. The other is to escape the never-ending problems of context with “same-precinct” tests: looking at election results at the precinct level, where all the voters had the same set of politicians on their ballot, and identifying which candidates performed better or worse with the same set of voters. This is broadly the approach used by Adam Bonica, Kasey Rhee and Adam Studen in their paper, “The Electoral Consequences of Ideological Persuasion.”
We prefer the same-precinct test, as it elegantly strips away so many of the problems of context-based WAR. The same voters, making selections in the same races, gave one Republican 56 percent of their votes and another Republican only 52 percent of their votes. It is a reasonable conclusion that the first Republican did a better job convincing voters. And this can be considered over the hundreds or thousands of precincts, and the many different overlapping races at the federal, statewide, municipal or countywide, and state legislative levels.
But even this method requires some context-adjustments. First, there is obviously value in incumbency that should be distinguished from candidate-level effects. Second, campaigns are expensive and candidates who do not successfully raise money will do worse. Then, more complexly, there are still places in the country where a “down-ballot lean” exists, where people prefer to vote for a Republican at the top of the ticket but will often cast their votes for Democrats in local races. (West Virginia and some other areas of Appalachia still have this character, although much less than they used to.) Finally, there are tendencies of voters in certain states and regions—New England and Hawaii most notably—to “crossover vote” for candidates of the other party, whereas in other states such as Florida and Colorado this is much less common.
The latter two are mostly minor adjustments, but they help prevent candidates from West Virginia and Hawaii from completely dominating the rankings. The incumbency and fundraising effects, however, make a big difference.
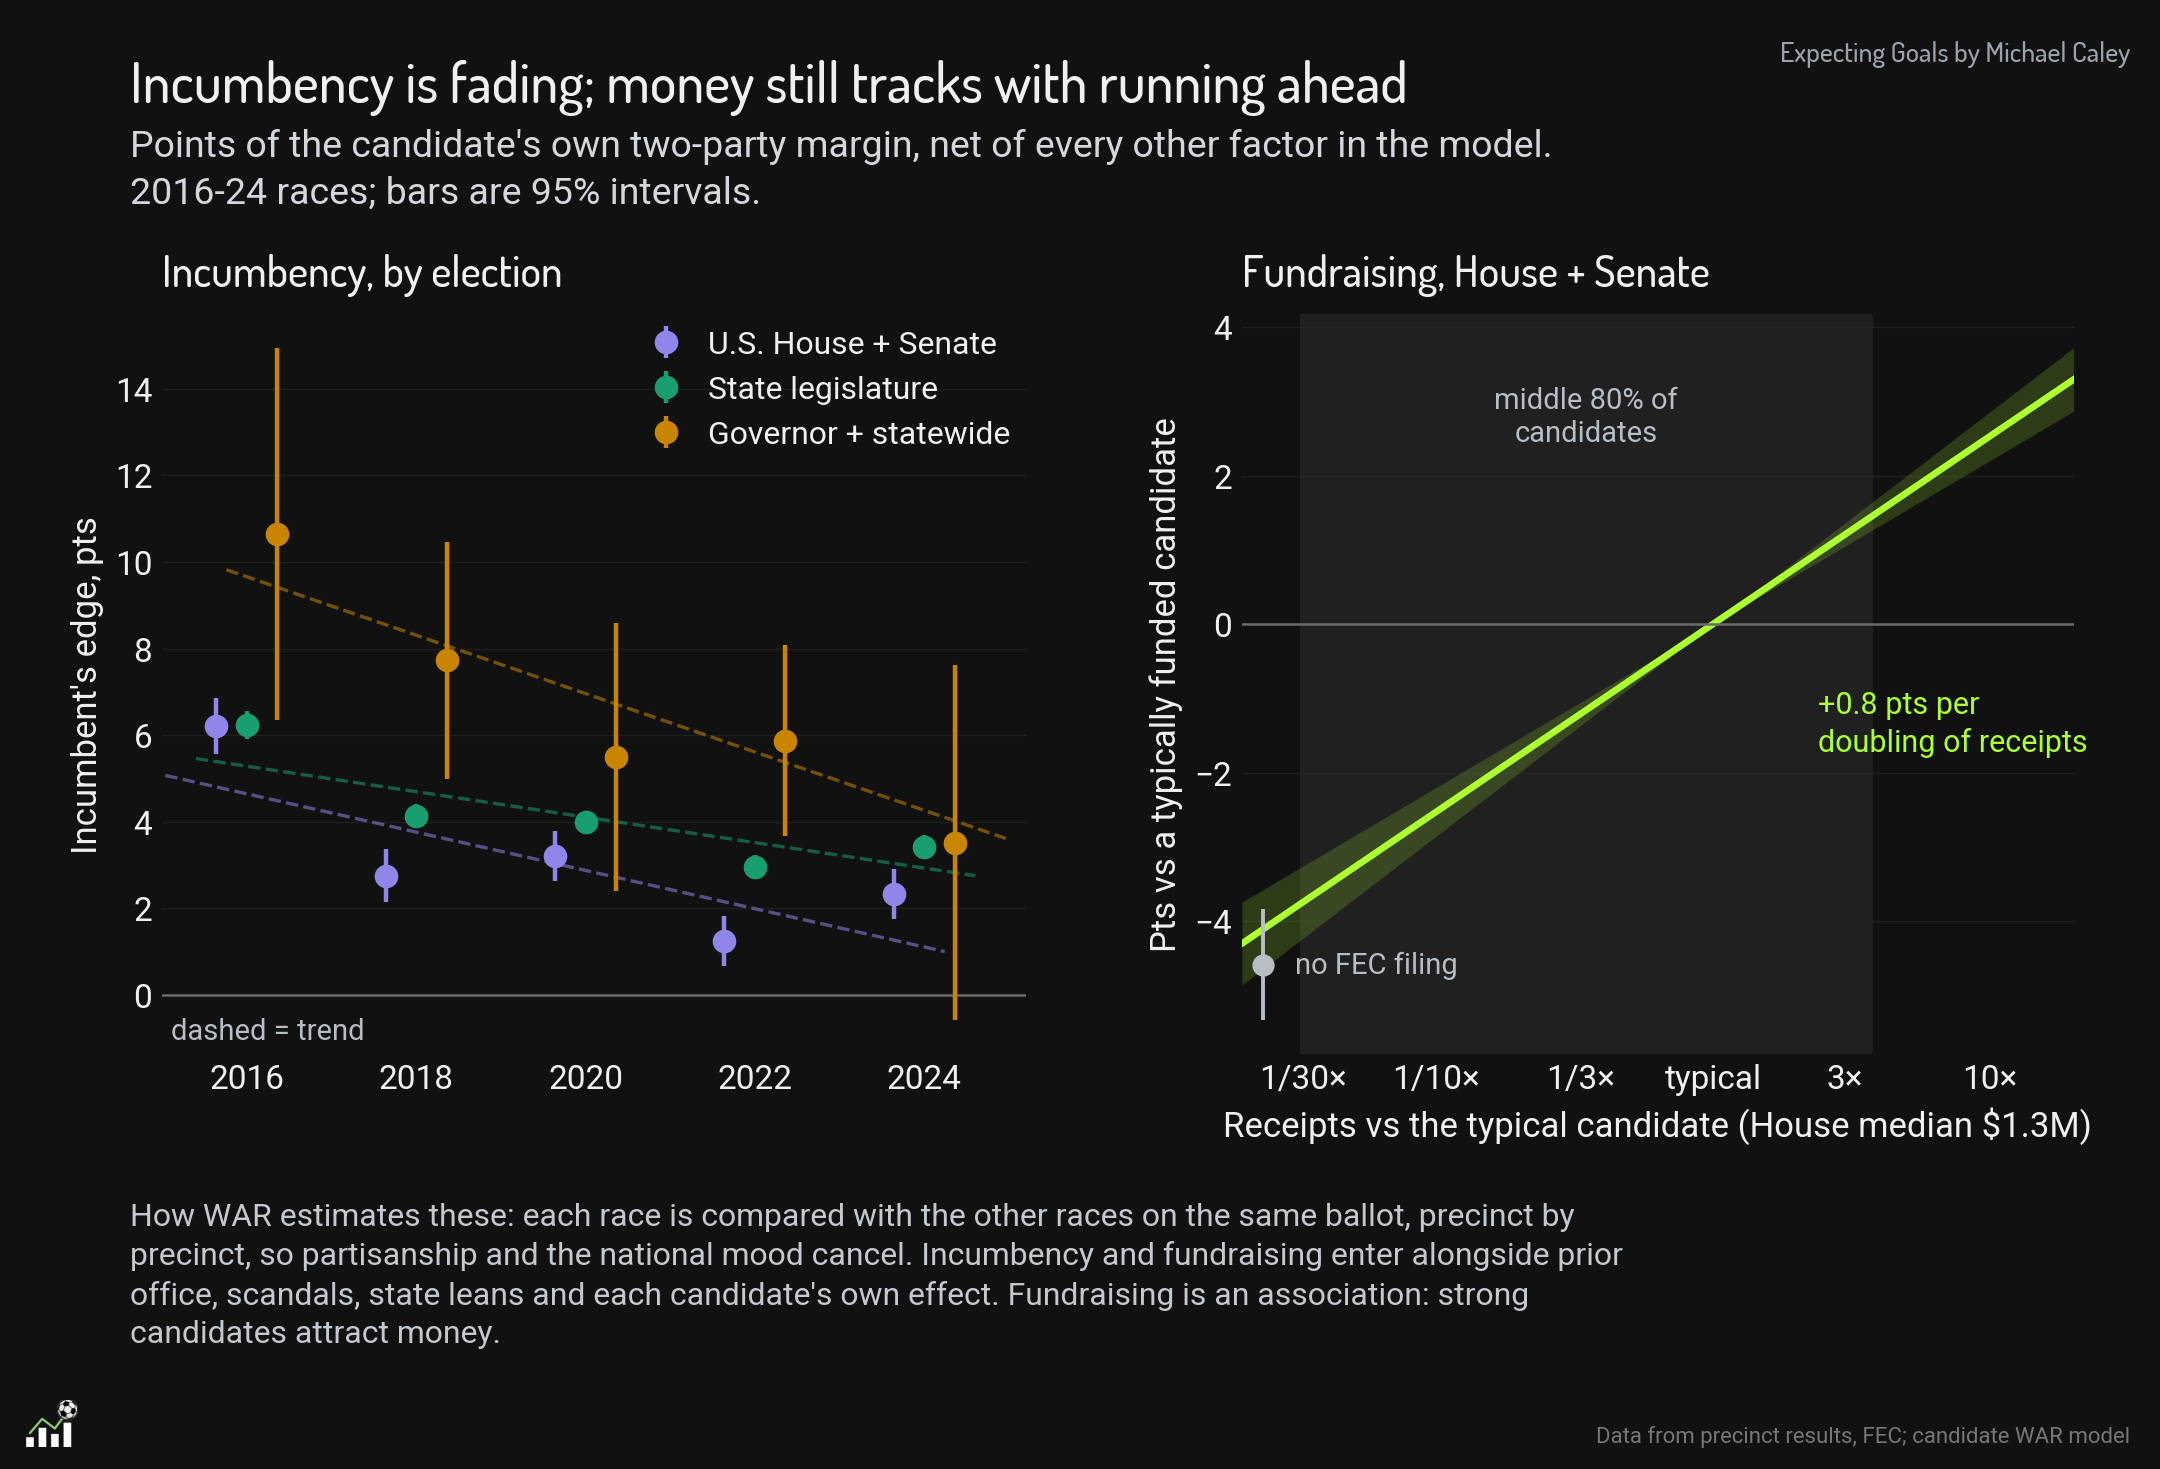
Incumbents clearly gain several points of margin against challengers, even after accounting for the tendency of incumbents to be able to raise more money. The incumbency effect is diminishing over time, although possibly more rapidly in federal and statewide races than down-ballot.
For fundraising, most of the effects are very modest. Even raising three times more money than your opponent is only worth about one point of margin. But at the extremes, candidates who do not raise enough money to file a report with the Federal Elections Commission at all run nearly five 8. points behind expectations, and candidates with an edge of ten times as much money gain a couple points. As noted in the graph, separating fundraising from candidate quality is a tricky problem. Being able to raise money is a skill. But we felt that it would be more interesting to separate WAR from fundraising, to show that even after fundraising ability is accounted for, these effects still remain.
We also included a scandal effect, drawn from the publicly-maintained big list of political scandals. we found that politicians who have a scandal underperform, and that corruption scandals matter more than any other kind.
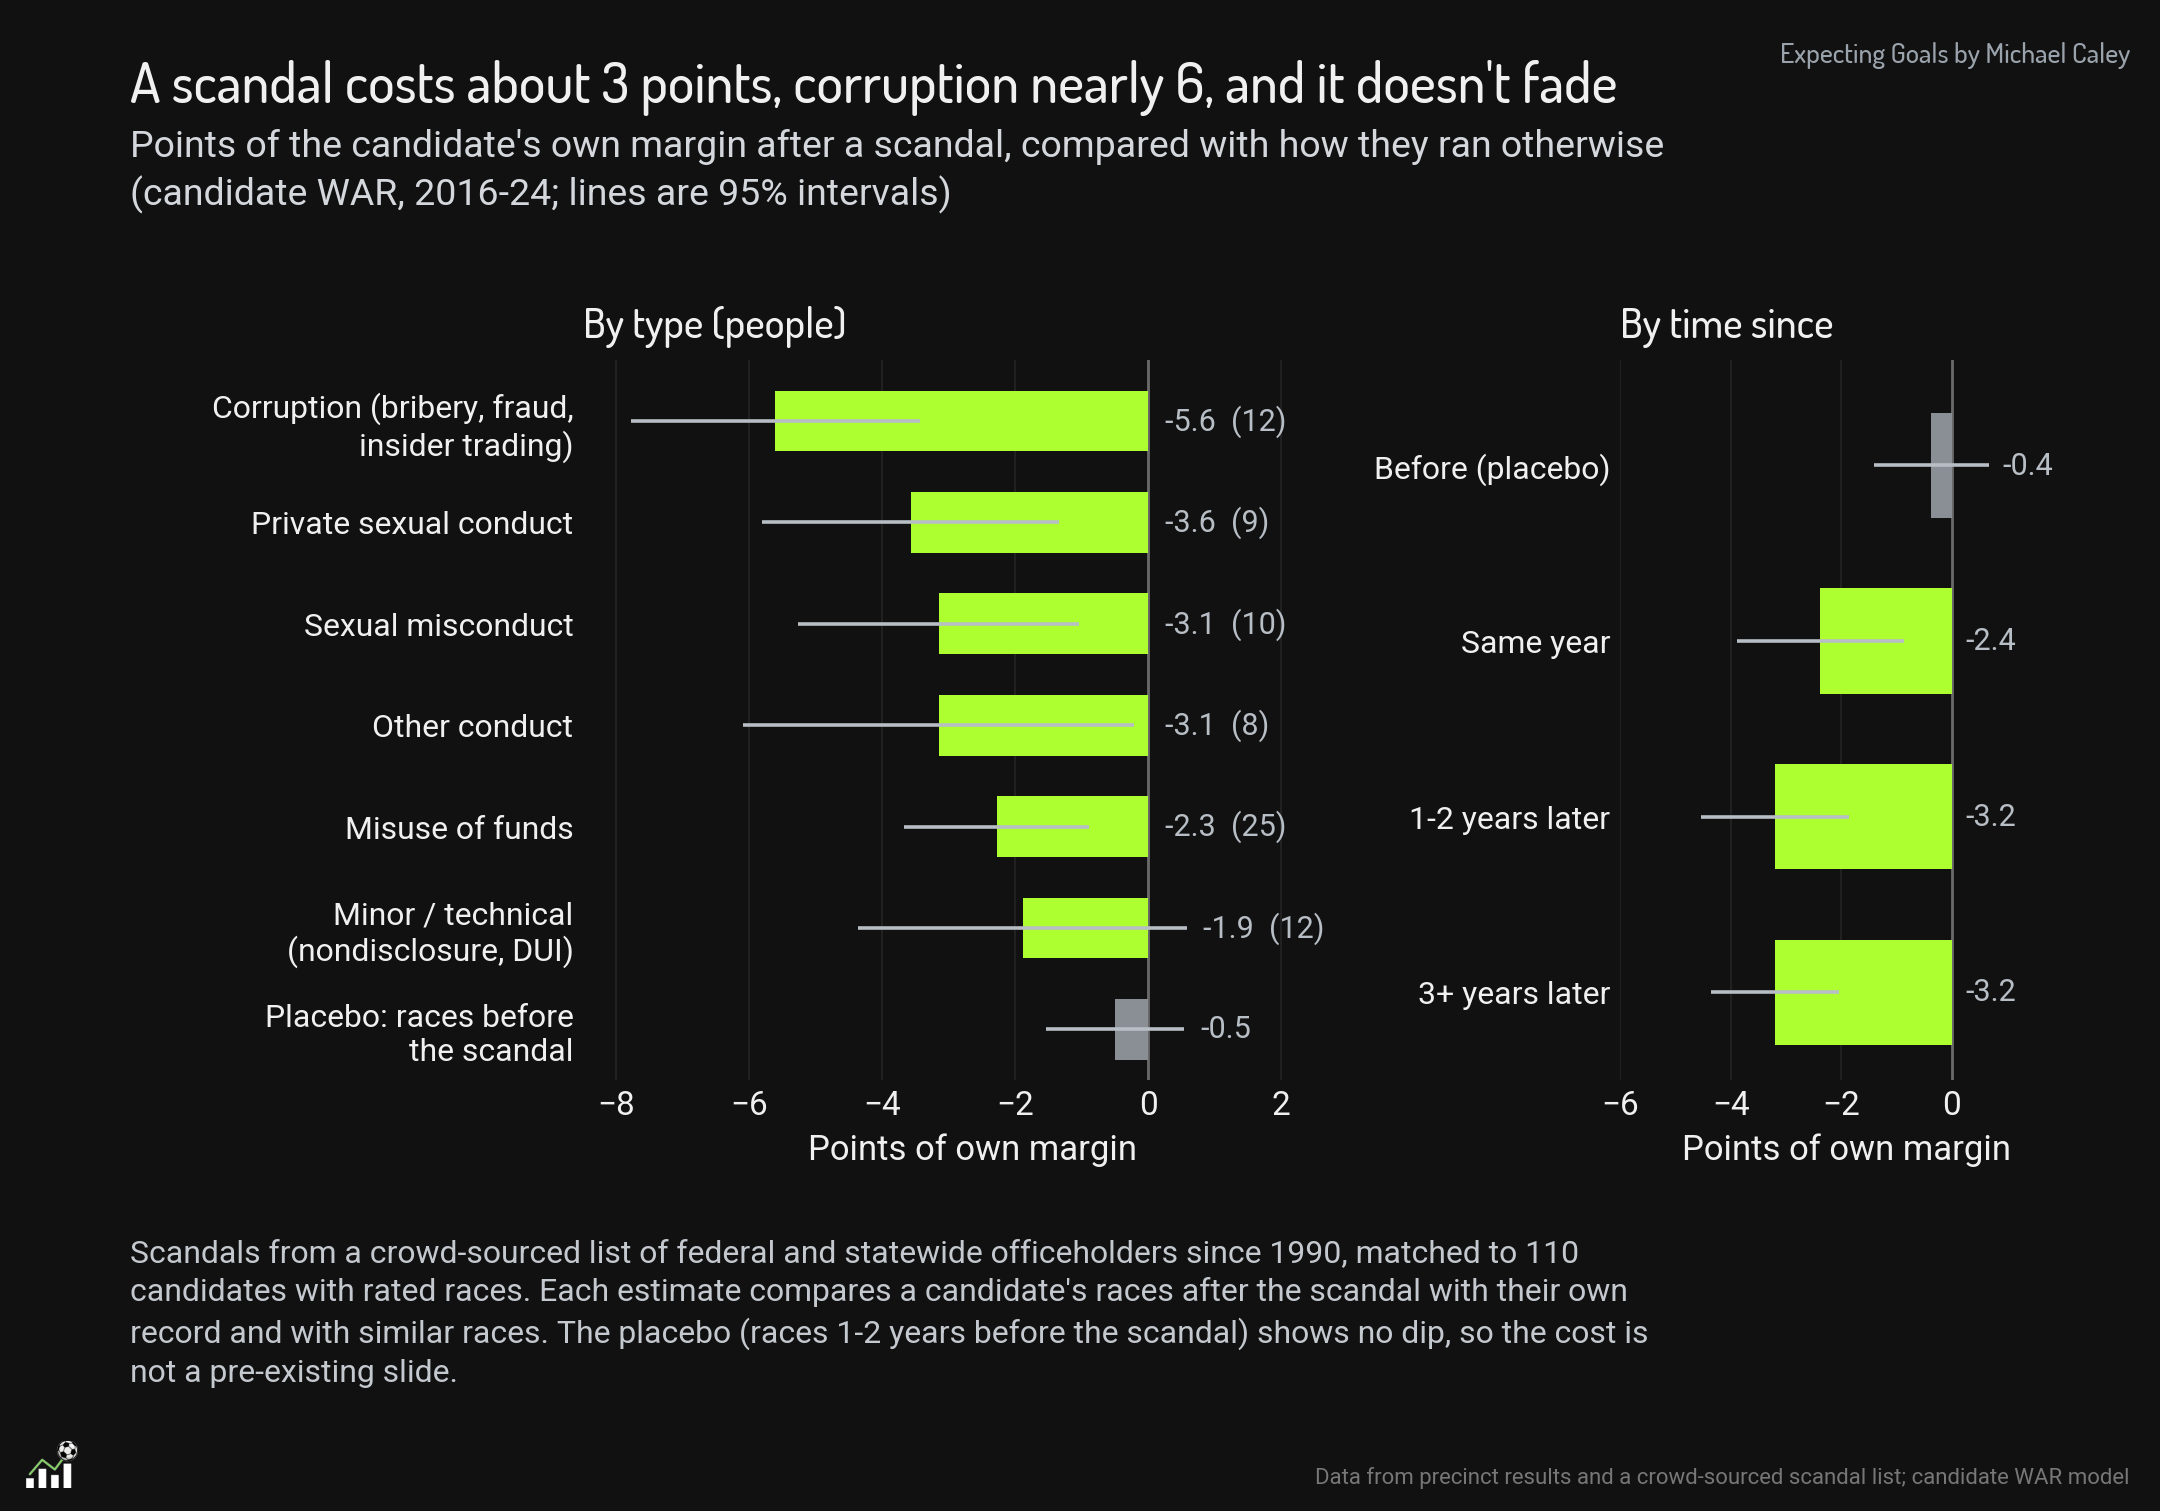
A scandal is obviously a reflection of candidate weakness. However, because the scandal can be reasonably objectively separated, we thought it made sense to distinguish problems caused by scandal from a candidate’s broad appeal.
Finally, there is the problem of sampling. Even with such rich precinct-level data, most candidates only have a few elections in scope. (Our precinct-level data goes back to 2016.) How can you differentiate which candidate in a race made the difference in the outcome? If a Democrat ran eight points ahead of other Democrats on the same ballot, was it because they ran a better campaign or because the Republican ran a worse one? Or was it because all the other Democrats on the ballot were weaker than usual?
For this, we used a series of regressions. All results are regressed toward zero based on a “heavy-tailed t” distribution. The regressed difference—that is, how much better or worse the Democrat did compared to other Democrats on the same ballot, after regression to the mean—is then split between the two candidates in the race. Candidates who have multiple elections against different opponents are given more and more credit for outcomes, both as compared to their opponents and in lower rates of regression.
The second WAR is what we are calling WAR-E, for Wins Above Replacement compared to Expectations. This is our version of the Split-Ticket WAR. It is a much more complex process, and it is also the method we consider the less useful of the two. Here’s how it works. For every race, we created a baseline expectation. This is set by the following factors
Presidential vote in the previous cycle.
National swing from the presidential vote across this election.
Regional and statewide swing effects, where certain states or regions move differently from the nation as a whole.
Demographic effects where areas with certain demographic character swing more or less than expected. The biggest example here over the last decade would be the rapid rightward shift of white voters without college degrees, concentrated in areas with lower rates of evangelical religious affiliation. Shifts toward Republicans in areas with such populations are larger than the shifts in other regions, and so those shifts are also attributed more to the national environment than to the Republican candidates.
We compared how candidates did compared to that expectation and then applied a similar regression effect to what was used in same-precinct WAR.
We were unable to map demographic data from the census onto voting precincts in some states and cycles, and we found that trying to map demographics by county instead of precinct created massive, unfixable errors. So for about 10 percent of races, we have only same-precinct WAR and not WAR-E.
While we prefer the “same-precinct” test, we wanted to have the WAR-E method as well because none of these methods are perfect, and sample size problems are overwhelming. If two independent methods of evaluating candidates show the same effects, that is a much more compelling result.
The following table has the WAR and WAR-E scores for all candidates in my database with at least two federal elections since 2016. They are scored only on those elections, as the method could not treat elections before 2016.6 We have also included, for reasons that will become clear shortly, the candidate’s membership in House caucuses that track affiliation and ideology.
For Republicans: the Freedom Caucus,7 the Republican Study Committee, the Republican Governance Group, the Main Street Caucus, and the Problem Solvers Caucus. For Democrats: the Progressive Caucus, the New Democratic Caucus, the Blue Dog Caucus, and the Problem Solvers Caucus. (The Problem Solvers are a bipartisan caucus.)
You can probably see some patterns start to emerge, while you can also see the necessary uncertainty in these scorings for any particular candidate that makes them hard to apply with confidence to most individuals. (You can also see that, no matter how hard we tried to account for it with those state ratings, Hawaii is just a weird place.)
But let’s get into the real meat of these findings. Here’s Joel.
Introducing Ideology-Affiliation Score and Caucus Similarity Score
Several months ago, I read an article by Michael Bailey and Benjamin Reese analyzing the effect of ideology on political outcomes (“Ideological Moderation and Success in U.S. Elections, 2020-2022”). Using a version of same-precinct WAR and a program called Wordfish, they found substantial effects where language associated with more centrist positioning on 2020 and 2022 House, Senate and governor campaign websites explained a significant amount of candidate performance. Moderates did better.
Wordfish is a text-scaling model that extracts political positions from text using word frequency to measure how conservative or liberal the text is. I thought that using Wordfish in 2026 seems, to be honest, quaint. We are now in a world where words are numbers that can be quantified in thousands of dimensions of linear algebra and large language models allow us to quantify and sort using language.
I realized that a single left-right continuum has many problems, from intensity to the multidimensional ways of understanding ideology, to the ways in which moving towards the “center” on some issues might be counterproductive (as per Broockman and Kalla), to the ways voters do not hold ideologically coherent positions on any given set of issues. “Moderates” as we know are not moderate in each domain but often hold competing extreme views.
Nonetheless, I began the project of measuring ideology by using the campaign website text from CampaignView that Bailey and Reese used. I ran a pairwise tournament—think Chess Elo ratings—between two sets of text and asking a language model which candidate was more conservative.8 That simple tournament structure did a pretty good job of sorting candidates from left to right. The ends of the spectrum were well sorted, with the Squad to the left, Blue Dogs to the right, but in the middle it was muddled and there was not much within-caucus variation outside of the extremes.
Michael and I discussed the project, and it seemed like we could do better than that. First, the CampaignView database could be expanded. We were able to expand the database to include state legislative candidates, add a large number of further websites, and collect, code and transcribe advertising copy run on Meta platforms. But more importantly, we both had concerns about a simple left-right model, and about the biases we would introduce by allowing a language model to define “liberal” and “conservative”. We realized that we already have self-selected designations within parties, reflecting gradations in ideology that go beyond left and right: ideological caucuses. And if we are thinking about ideology in terms of affiliation, joining a caucus is obviously an act of group affiliation.
What if we built a model built from the text that candidates to describe themselves and advertise about themselves in order to predict whether they belong to a specific ideological caucus? So that’s what we did. First, we gathered a list of each caucus’s members, as listed in the table above.
Next, we asked Claude (Opus 5.5) to create descriptions of each ideological caucus based on the website and ad text of 80 percent of each caucus’ members. (The other 20 percent were held out for confirmation.) We masked terms which could have tipped off the model: the names of the caucuses, candidates, and parties, the names of their state or district, and references to incumbency like “Congresswoman” or “re-elect”. These summaries are not perfect, but they certainly ring true to us. Here are core summaries of the three major Democratic caucuses:
“Blue Dog sites advertise gun-owner credentials in a way other Democrats almost never do. They announce National Rifle Association endorsements and “A” ratings, describe the candidate as a lifelong hunter or sportsman, and call him or her a defender of Second Amendment rights. They also list endorsements from the Fraternal Order of Police, county sheriffs, deputy sheriffs’ associations, police officers’ associations and firefighters. Law enforcement support is presented as a mark of being a mainstream, safe choice.”
“A site sounds like a New Democrat when it organizes its agenda around concrete costs and benefits for middle-class and suburban families, emphasizes bipartisan accomplishments and delivered results, supports police and veterans alongside gun safety and reproductive freedom, and avoids the language of structural justice and movements. A Democratic site built around racial, economic and environmental justice, Medicare for All, housing as a right, or peace activism reads as unlike the New Democrats. A site built around rural agriculture, guns and fiscal conservatism reads as more Blue Dog than New Democrat.”
“[For the Congressional Progressive Caucus] Justice as the organizing word. The single most distinctive feature is the vocabulary of justice and equity: racial justice, economic justice, social justice, environmental justice, criminal justice reform, immigration justice, housing justice, reproductive justice, gender justice. Sites speak of “communities of color,” “Black and brown communities,” “people of color,” “marginalized communities,” “low-income communities,” and say policies “disproportionately” affect them. They discuss systemic and institutional racism, redlining, discrimination, disparities in health, wealth and education, inequality, and equity.”
The language model was able to pick up on not just how the Progressives were to the left of other Democrats, but also more distinctive flavors of affiliation, contrasting the more suburban, pro-business and national-security-minded New Democrats to the more rural and socially conservative Blue Dogs.
Next, instead of the pairwise tournament I originally conceived of, we used a sorting methodology for each caucus. We asked a classification model to read the text of candidate websites and advertisements and produce an estimate of whether the candidate “sounds like” a member of each caucus.9 For example, using the description of the way Freedom Caucus members talk about themselves, the model reviewed every member’s website and ad text and predicted whether that member belonged to the Freedom Caucus.
If the model found a phrase like, “With Trump, he will end inflation, seal the border, and deport all criminal illegal aliens, and fight for us.” or “The right to keep and bear arms is a God-given, inalienable right enshrined in our Constitution,” it would be more likely to classify this candidate as sounding like a Freedom Caucus member.10 If it found a phrase like “I will always advocate for solutions to our challenges and work in a bipartisan manner to deliver results”, it would be less likely to make such a classification.11
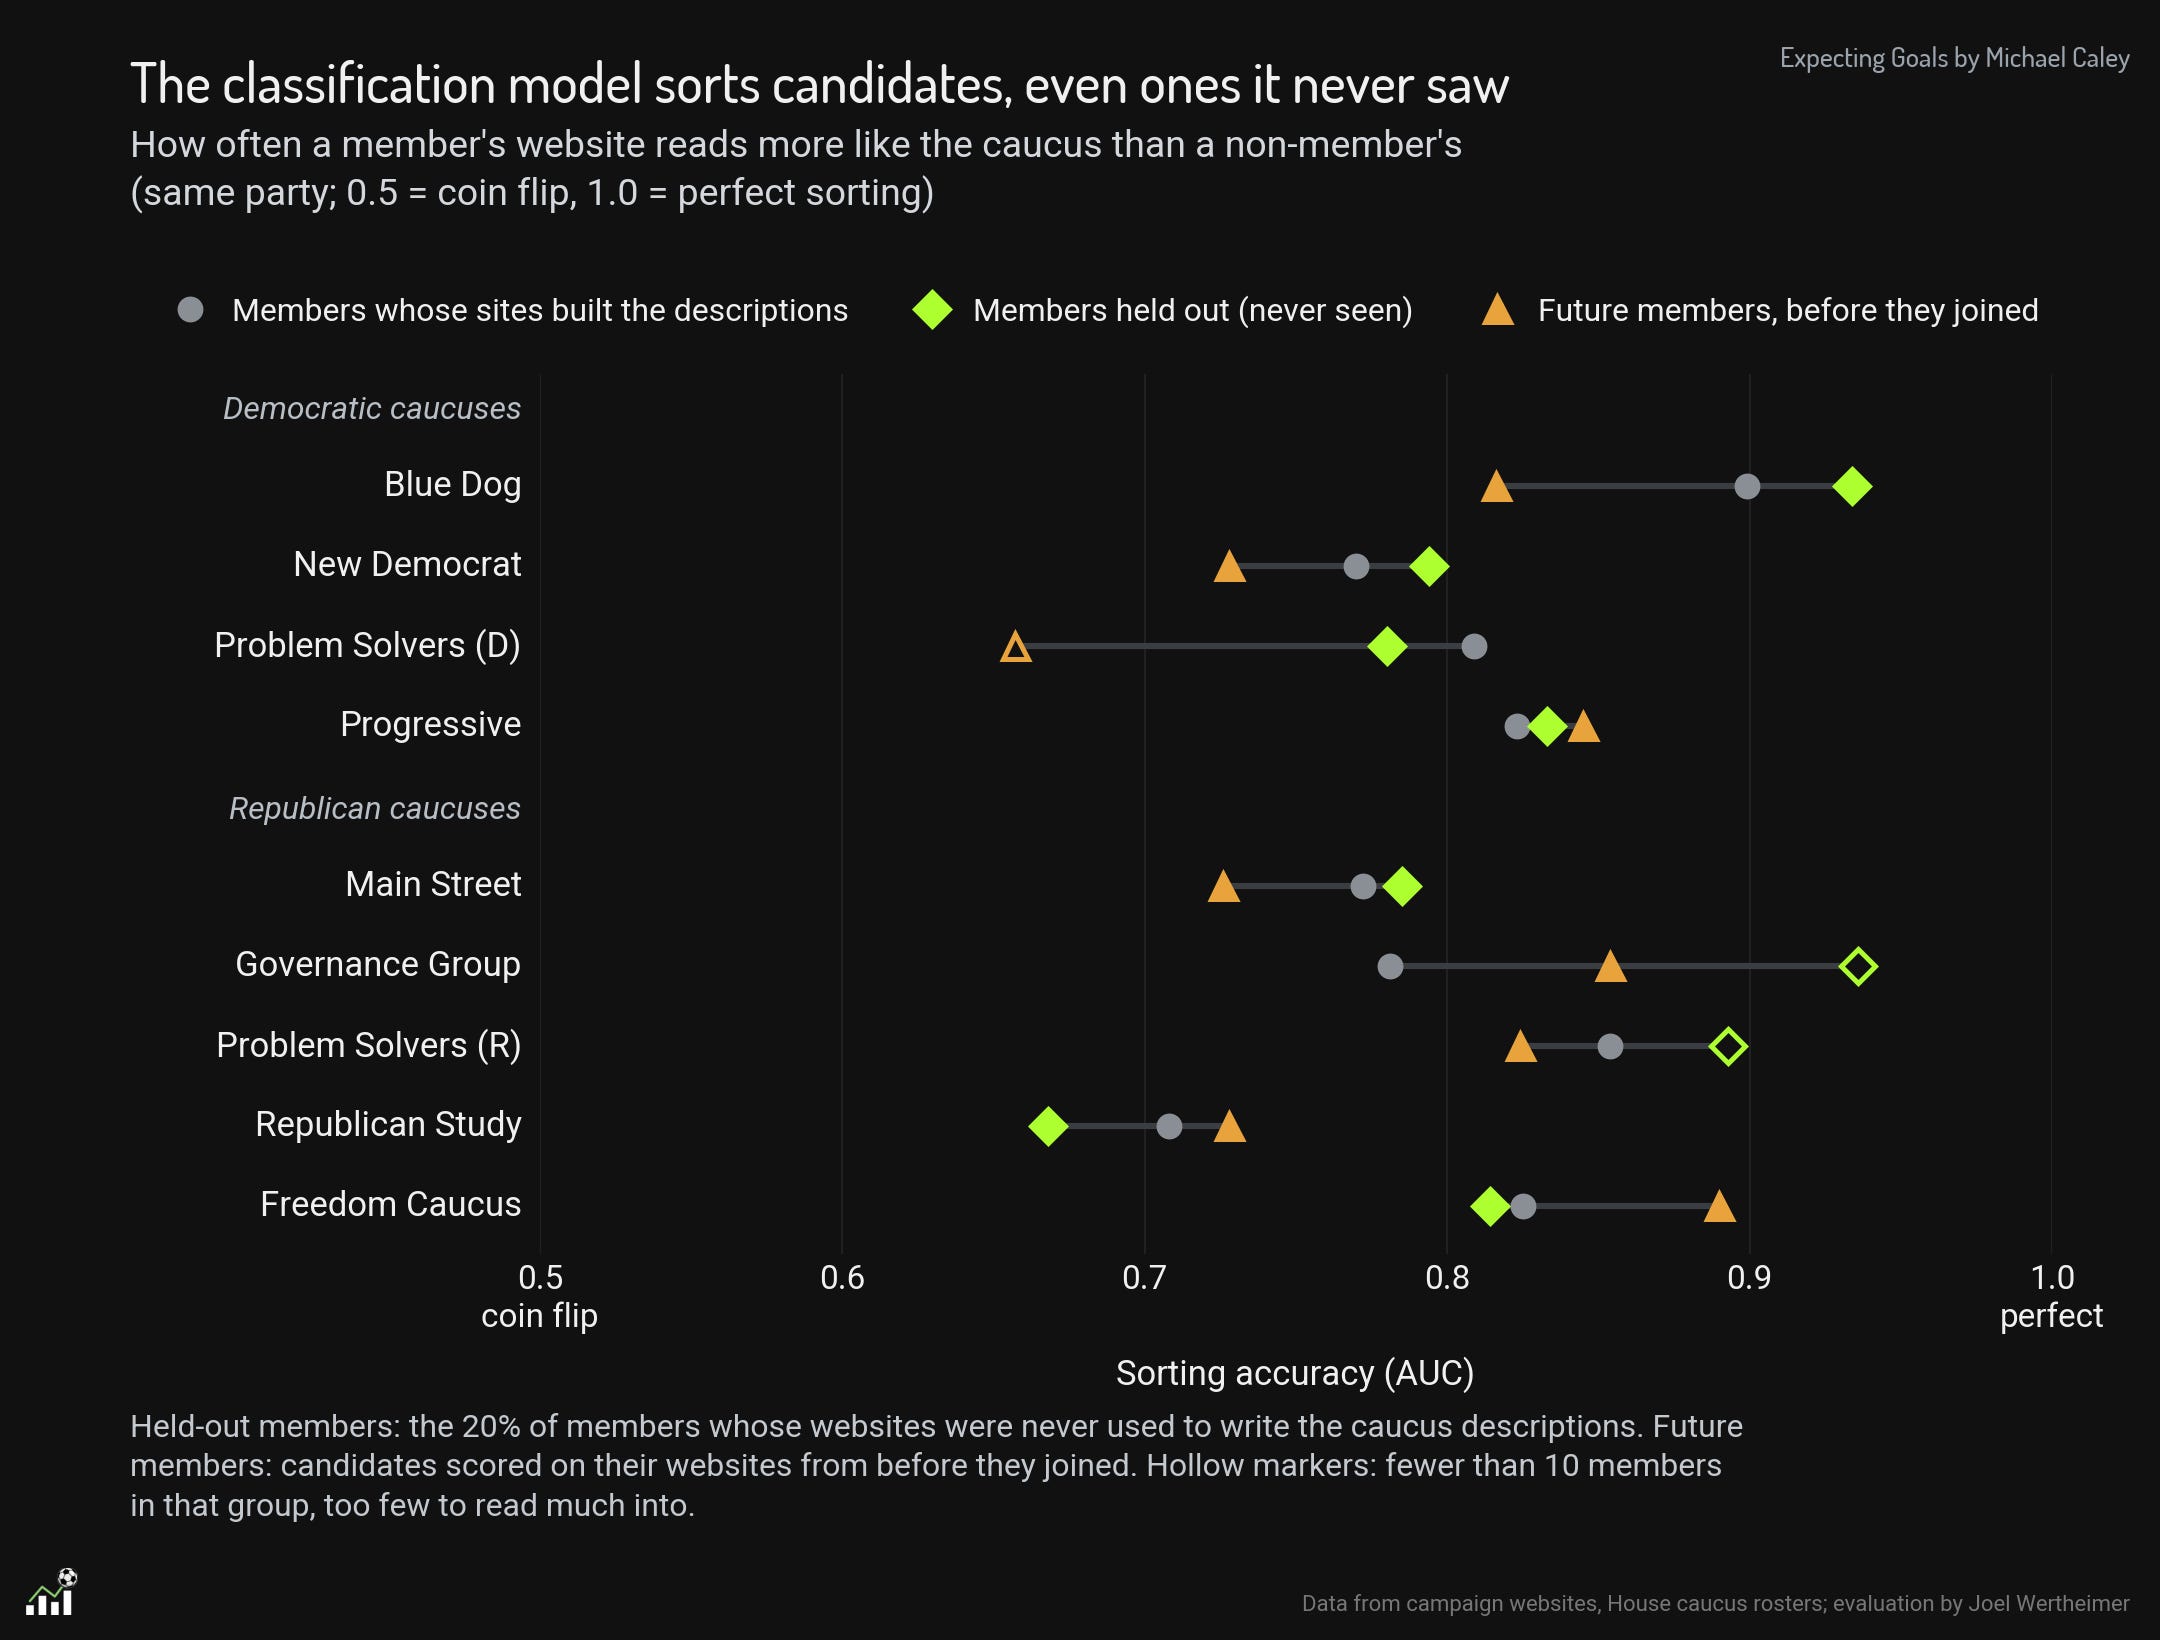
Using the descriptions, the classification model was successful at sorting candidates into each caucus. It worked on both the websites and ads used to build the description and the 20 percent that were held out. Moreover, the classification model was able to successfully sort candidates based on the language of their websites and ads before they ultimately joined the caucus. Here’s how well the model was able to sort candidates into caucuses based on the language they use:
We can also take this further, beyond just candidates for the House. The same descriptions and sorting mechanisms could be used to analyze the affiliations and ideology of candidates and electeds outside of Congress. Does the Democratic gubernatorial candidate in Kansas sound like a Progressive or a Blue Dog? What about a state legislator in Nevada? By creating these gradations based on the large national caucuses, we’re now able to sort every politician using the caucuses as the tent poles for the different flavors of ideology within each party.
Then we created a single measure of whether the candidate appeared more or less like the flank of the party. This is, do they sound like a moderate or conservative Republican, or do they sound like a moderate or progressive Democrat. The more Blue Dog and New Dem a candidate sounds, the more moderate they are scored. The more like a Freedom Caucus or Progressive Caucus member a candidate sounds, the further on the flank they are scored. (The relative scores were created by identifying a single dimension of similarity that best captured the positioning of these caucuses relative to their party.)
So what is our contribution to the big Ideology Debate? More moderate candidates do significantly better than candidates from their party’s flank. In particular, we found that when you use ad text and campaign websites to determine ideological affiliation with a caucus, the 10% most moderate sounding candidates in each party run 3 to 4 points ahead of other candidates running in the same precinct as they do, and the most flank-sounding candidates run 2 points worse.
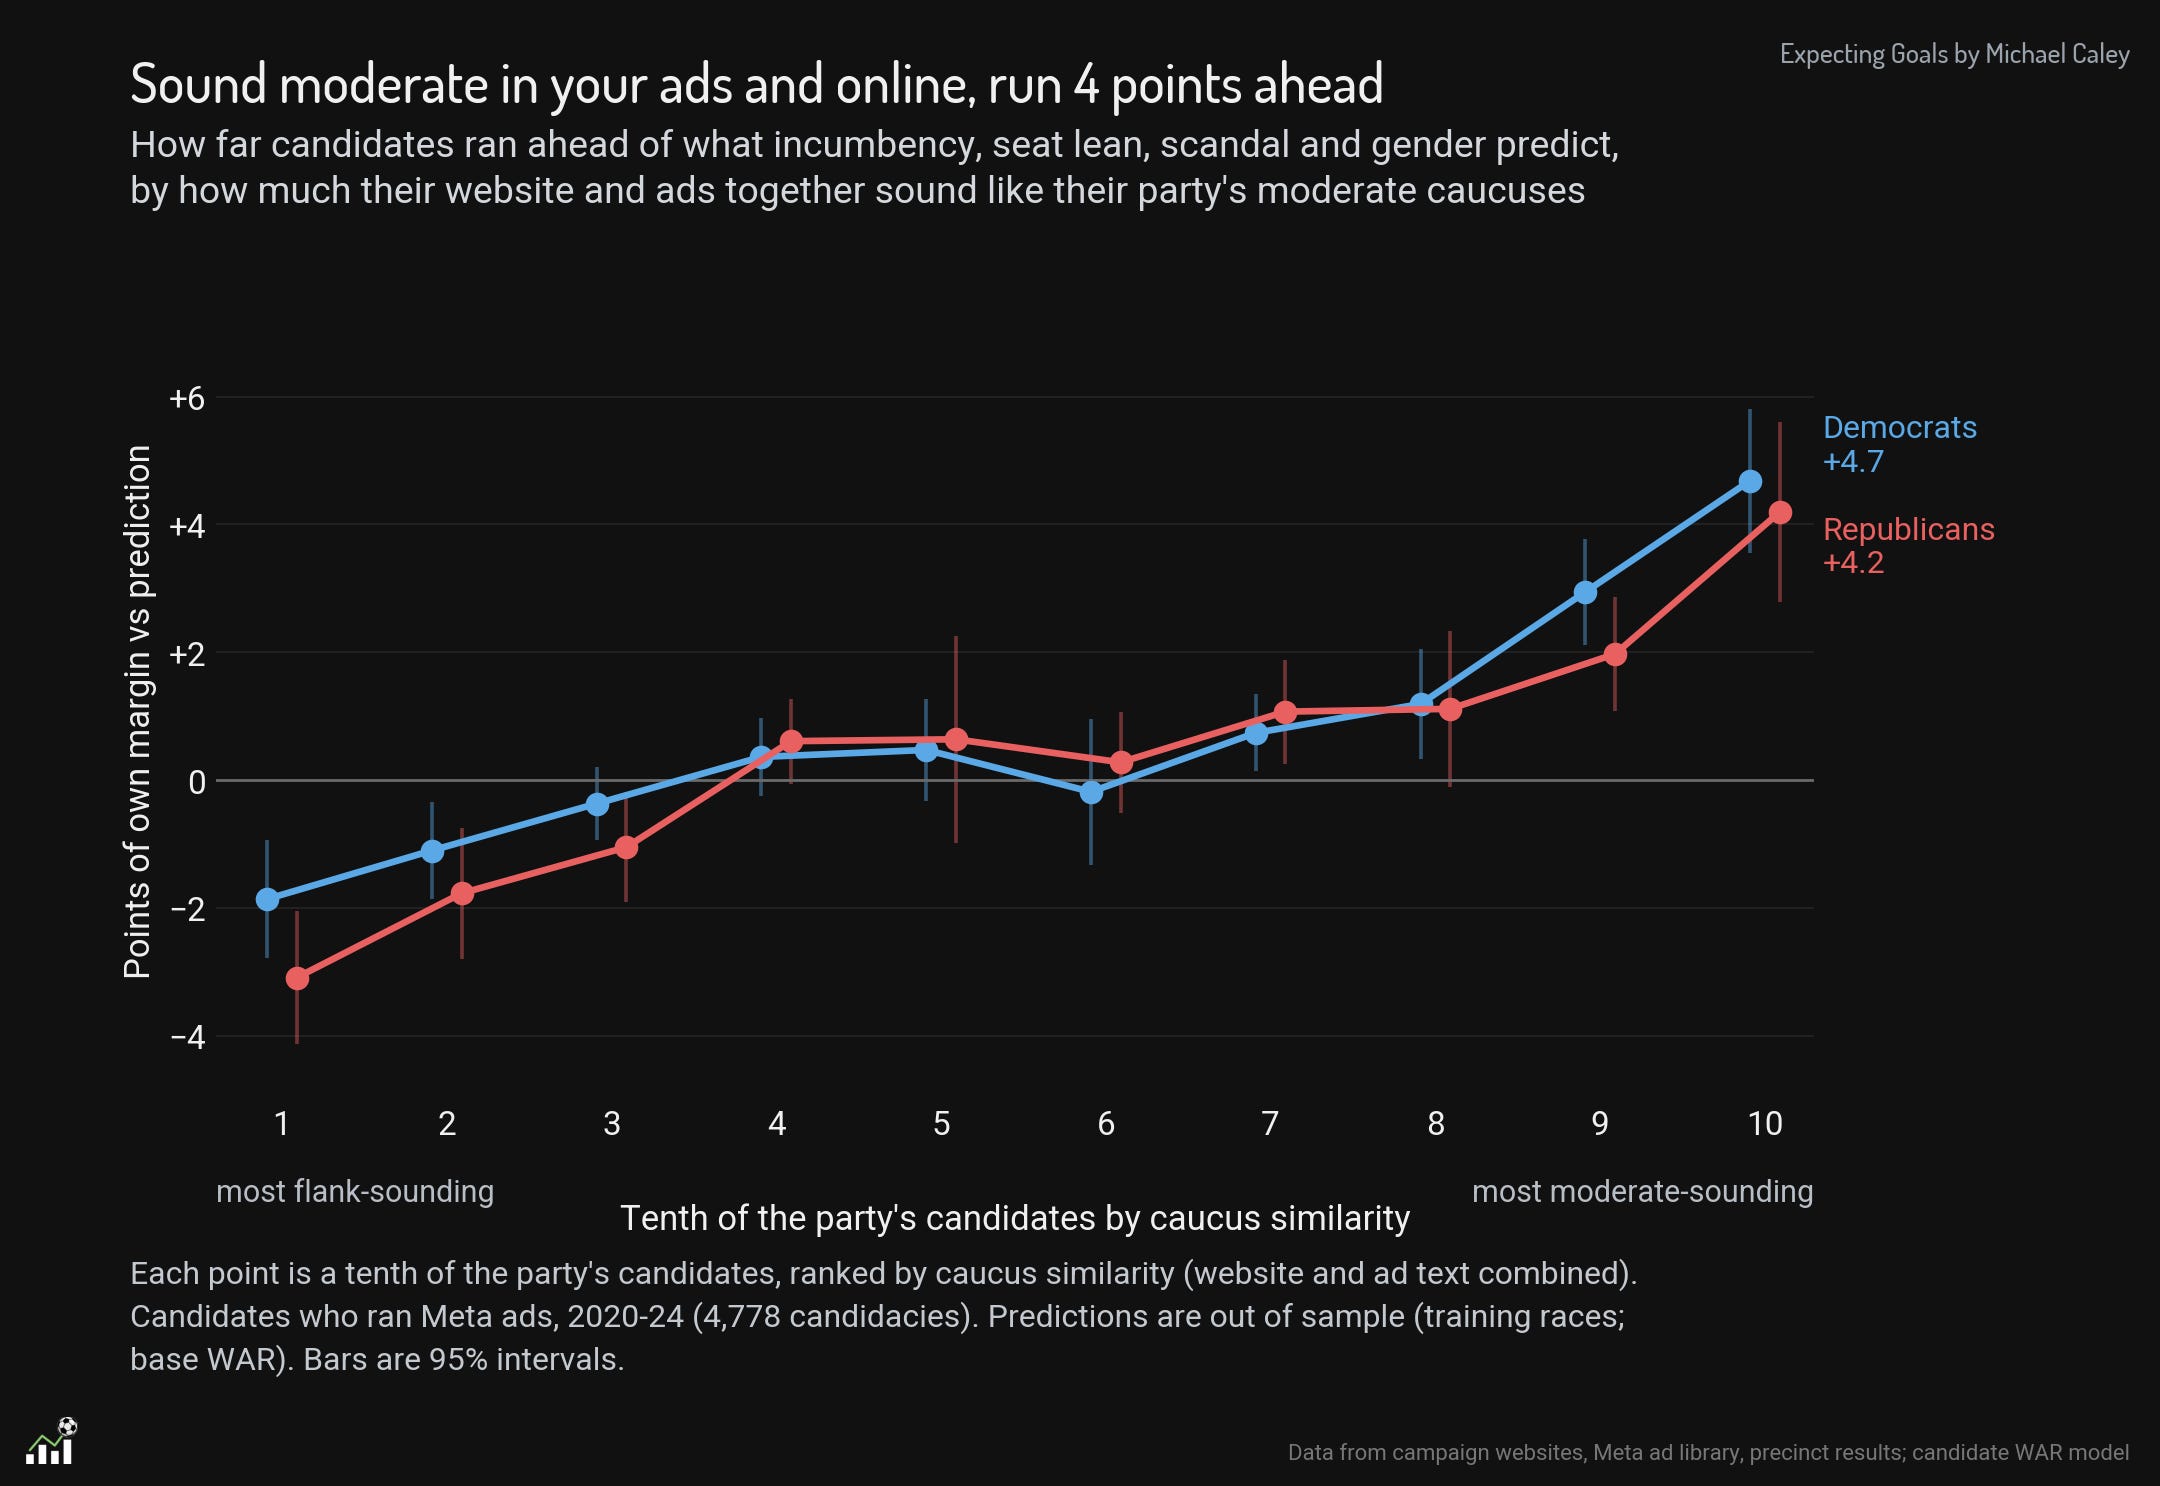
To put this in context, this is roughly saying that in the same precinct, controlling for the factors we can control for, a candidate that sounds like Jared Golden would run about 5 points ahead of a candidate that sounds like Jerry Nadler in their ads and on their websites.
We selected the ideology-affiliation score built off the caucus similarity score because it performed by far the best of all our different models in improving our out-of-sample predictions.
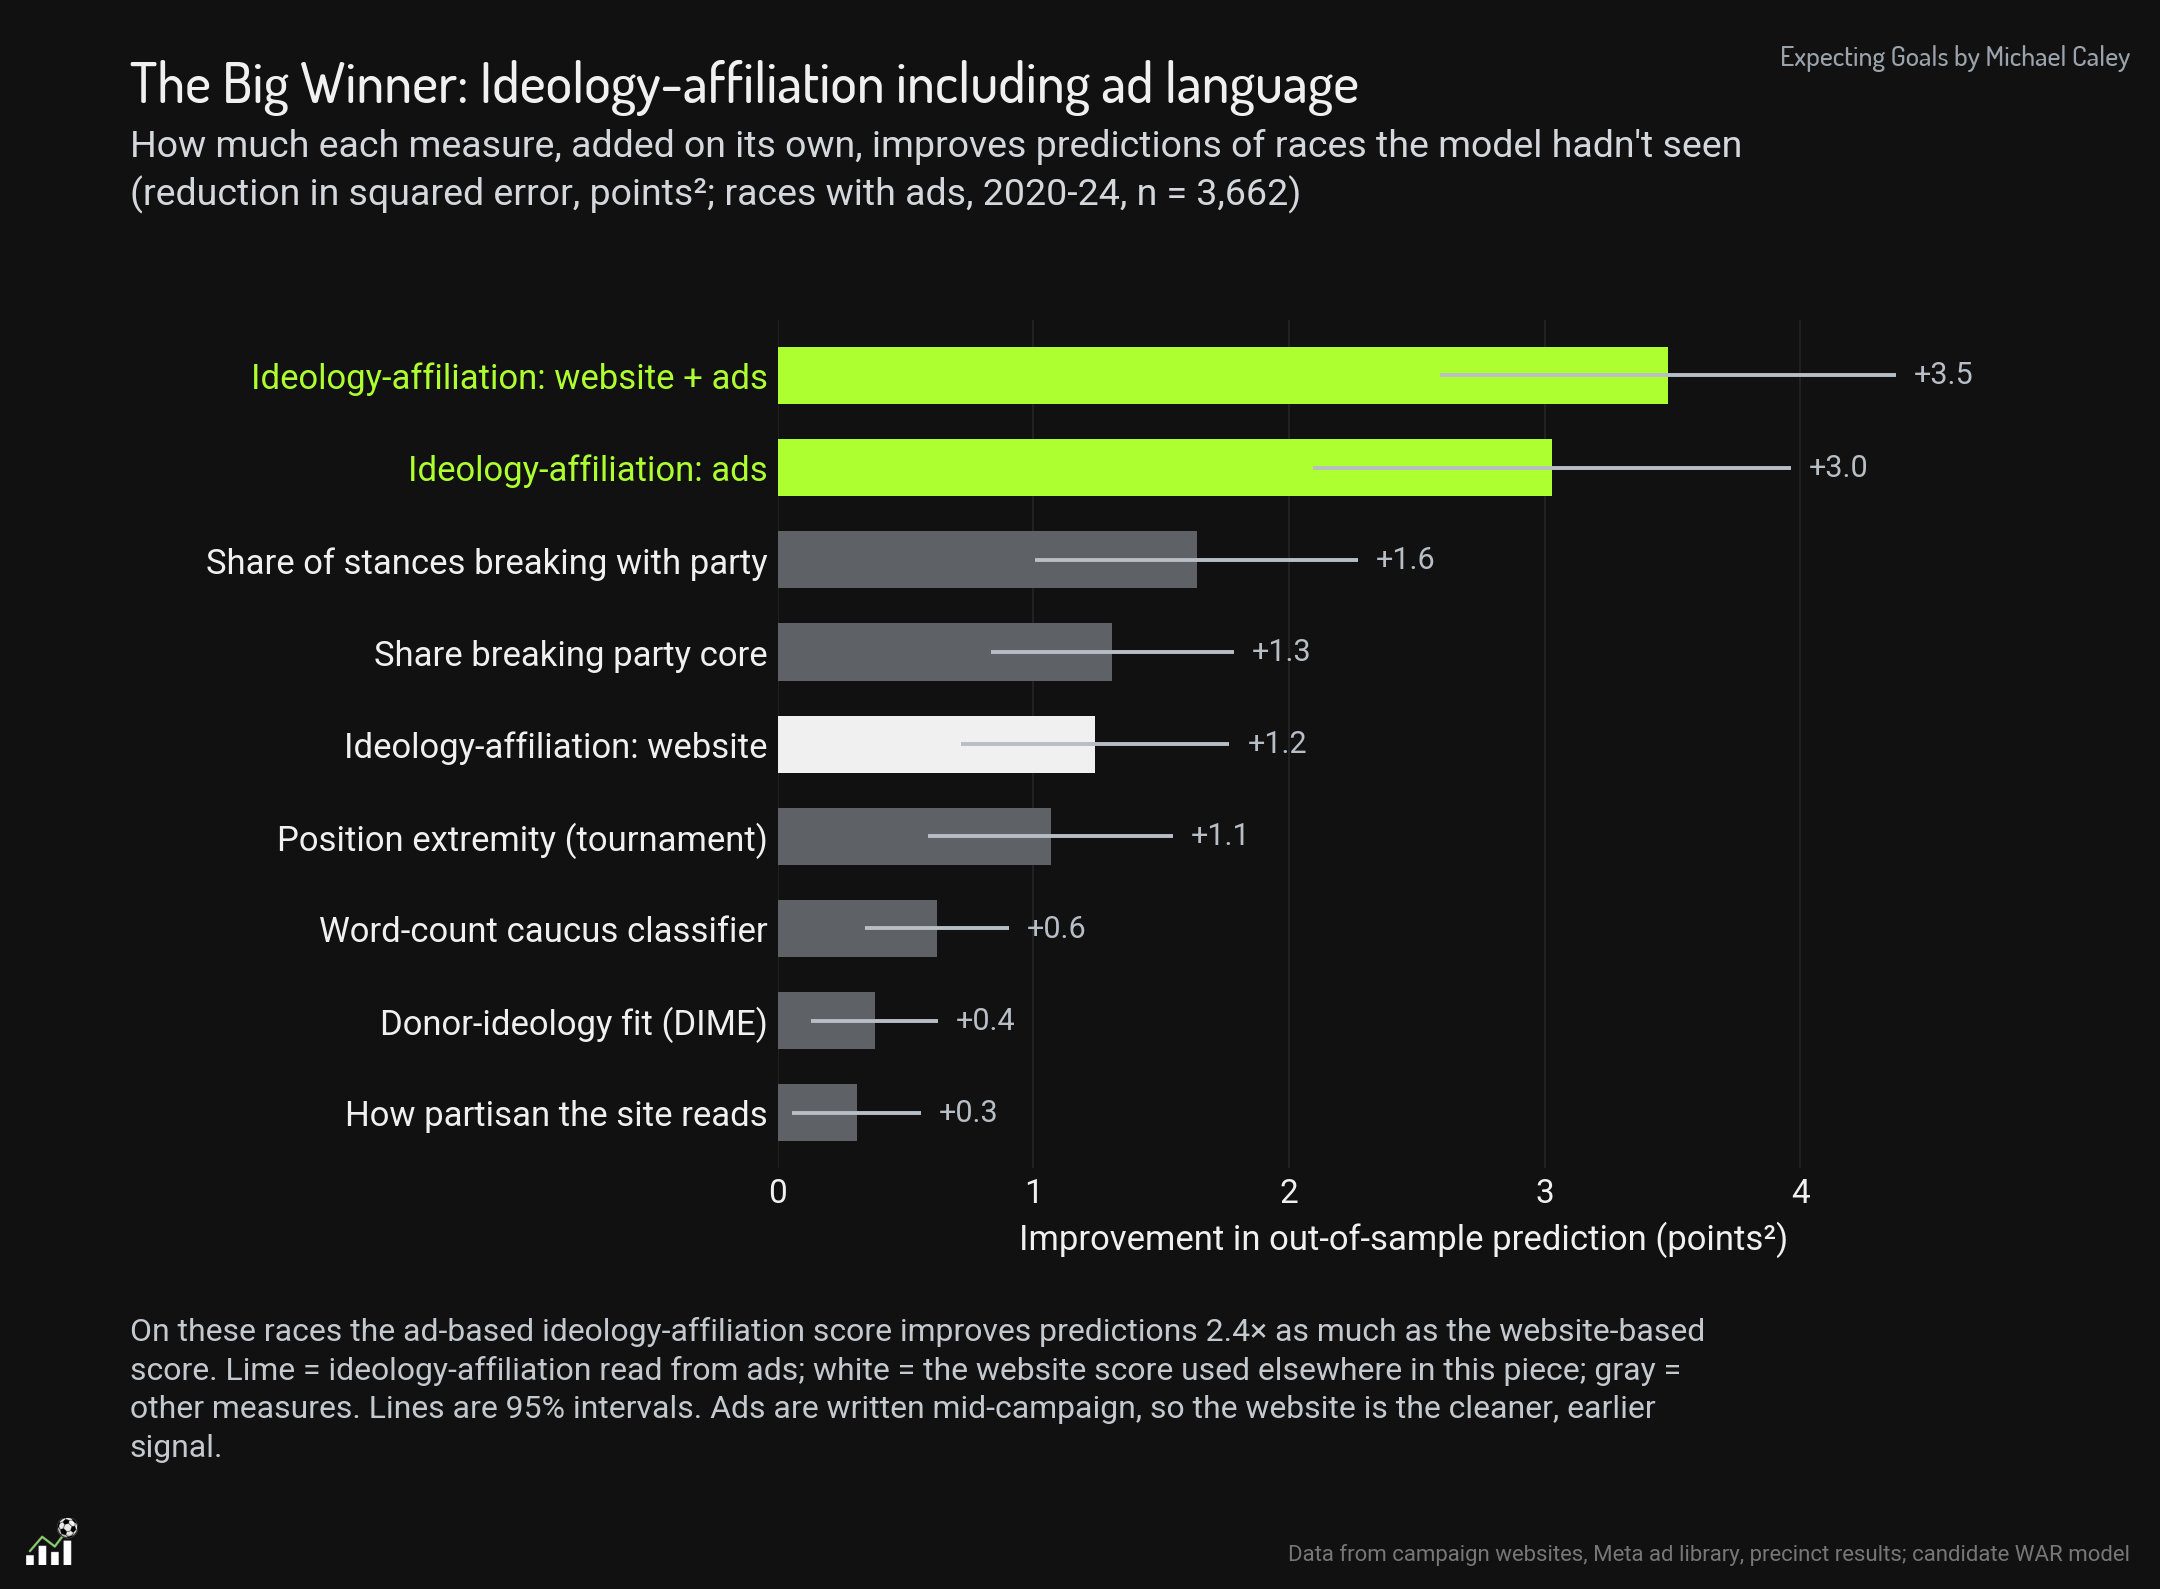
None of our other attempts at measuring ideology (which we can describe in another post) came close: Joel’s original left-right extremity tournament, Michael’s hand coding of the number of breaks with the party a candidate expresses on their website,12 and even ideology-affiliation using the website alone fell a long distance back.
The importance of ads is notable. The ideology-affiliation score built off both ads and website text performed more than twice as well as any other method that did not include ad text. If you want to learn what a candidate is all about, listen to the messages they’re spending money to send to you. Websites offer a much larger volume of text, but it is less targeted at telling voters about who the candidate is, using their preferred messages. The issue positions on candidate websites resembled much more the messages they spend on ads during primary season than during the general elections.
This is also a function of ad-sorting. We split out ads that were aimed at persuasion from ads aimed at fund-raising, mobilization, or list-building. The scores are based only on the persuasion ads. (Michael’s hand-coding did help here for modeling ad purposes.)
We also found that not all caucus moderation impacts outcomes the same. In fact, using our index and individual caucuses separately, we found that being more like the Blue Dog Caucus rather than the New Democrats is electorally advantageous and that being like a Freedom Caucus member is particularly harmful.
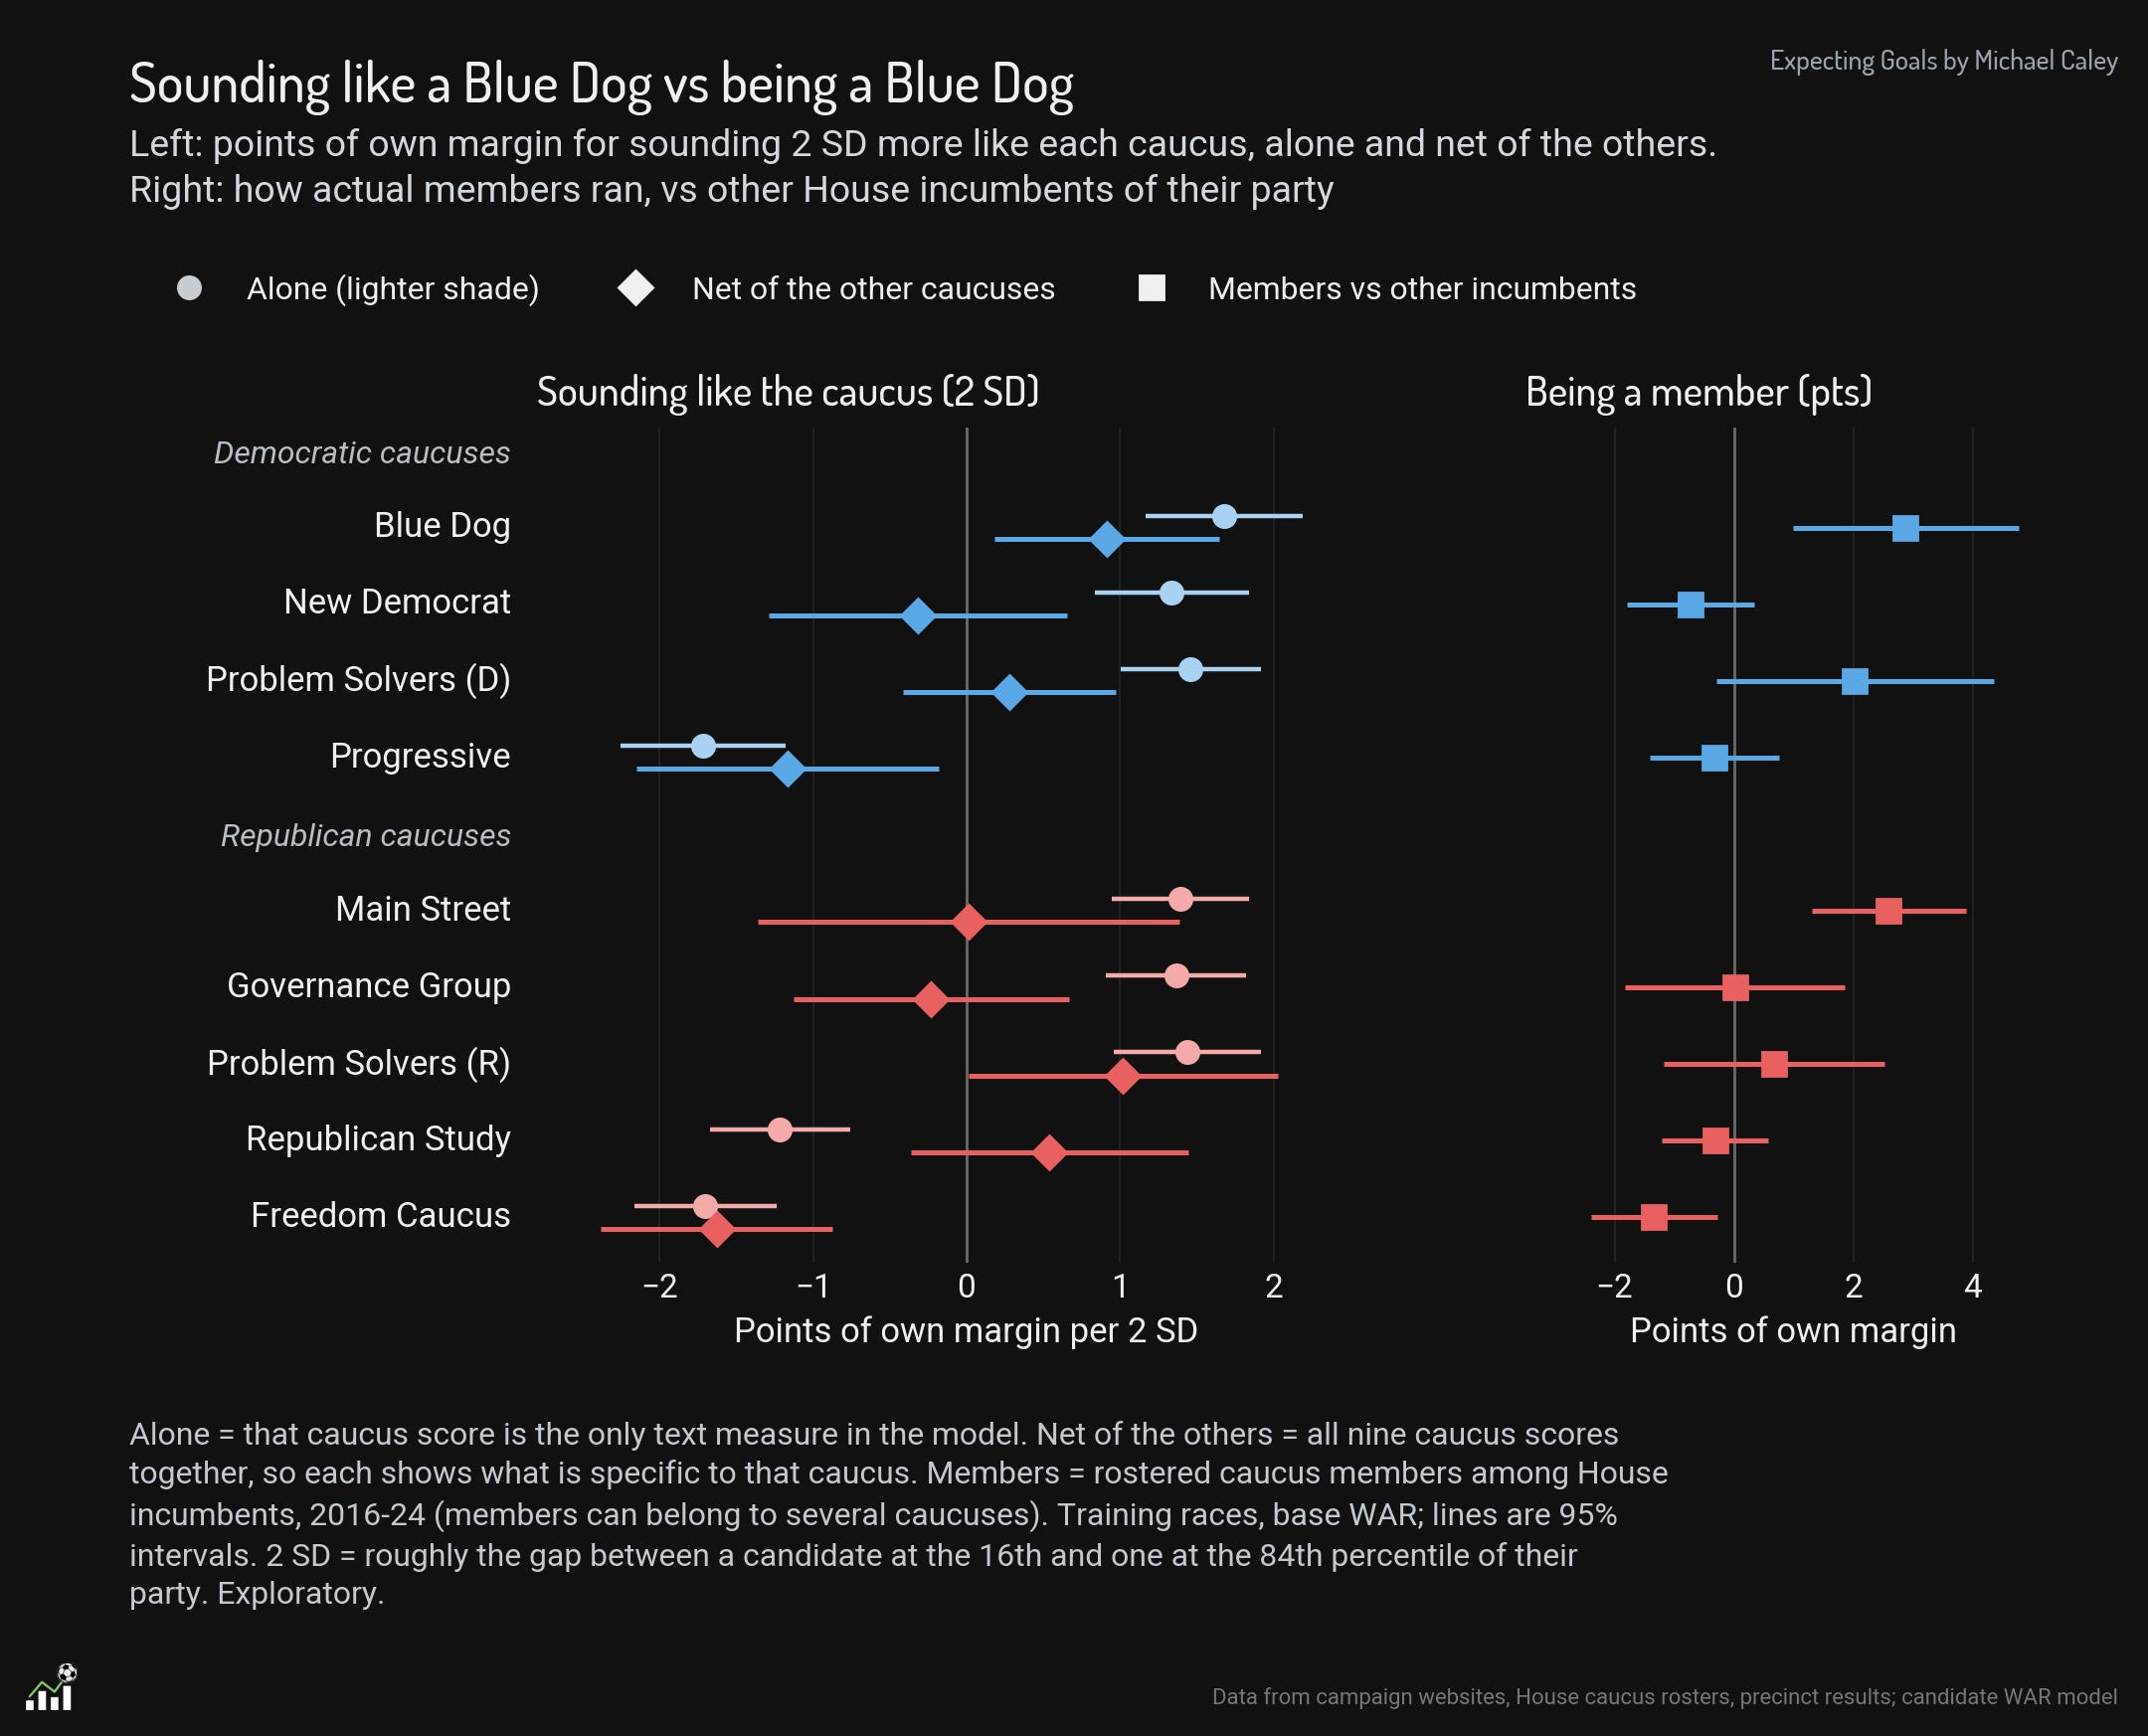
What was even more striking is how some of these similarities turn negative when they are separated from the others. The Republican Study Committee is striking. Members of this committee generally underperform more moderate Republicans, and candidates who sound like Republican Study Committee members do not perform well. But then why does the RSC score as positive when it is “net of other caucus similarity”? It is because RSC members are conservative Republicans who sound a lot like Freedom Caucus members. To the degree RSC members talk like Freedom Caucus members, they perform worse. But when they speak in the wonky tones of the Study Committee instead of the, let’s say, direct and unvarnished language of the Freedom Caucus, that projects slightly better numbers.
Pre-Election Picks
Why are we rushing to get this out today? Well, people will tell you that correlation is not causation and there are any number of ways that our model could be criticized and our findings could be questioned. We wanted to register some pre-election predictions based entirely on our modeling, selected according to objective requirements. Putting 50 predictions out into the world cannot prove anything, but it seemed like a good opportunity to put our methods to the test, and if we’re right, that would be cool.
These predictions, like our same-ballot tests, are comparing candidates in the same party and picking one of them to do better than the other, in their respective races. They are based on the ideology-affiliation scores. There are three sets:
Statewide picks, where both candidates are running in the same state.
House picks, where the candidates are running in districts we project to have a similar lean, with the same incumbency status.
Same-ballot picks, which are really our core predictions. Here we will be looking at how the candidates do only in the precincts where both are on the ballot, just like how the WAR model works.
We did not look these picks over before submitting them. It’s a little bit scary to be honest.
Statewide picks
House Picks
Same-Ballot Picks
Appendix
In a strange way, one of our favorite parts of this project was just seeing the text of campaign websites and ads repeated over and over. The patterns got very funny. Here’s a selection of language from candidate websites and ads that is particularly representative of the different caucuses.
His first major political analytics work involved adapting the methods used for his PECOTA projection system to compare congressional districts and project whether Barack Obama or Hillary Clinton would win a certain race, and how many delegates, based on the demographics of the district. The results of this model beat the polls by wide margins, and baseball analytics methods launched Nate Silver’s political forecasting career.
There is an extensive literature in actual political science on the question of what ideology actually is and how it impacts politics, and the academics have it right that this is a much harder problem than people tend to assume. The two books I read that most structured my thinking on this topic are Lilliana Mason’s Uncivil Agreement and Neither Liberal Nor Conservative by Donald Kinder and Nathan Kalmoe. Both books make strong arguments, in different ways, that despite all the ways that politics seems ever more driven by debates between ever more coherent and polarized groups of progressives and conservatives, most people do not appear to hold to proper, consistent ideologies. Mason’s notion that deep feelings of group affiliation sit at the base of modern polarization is, in many ways, what our model is ultimately based on.
I have written about how soccer analytics remains a long ways off from a player value statistic because both questions, but particularly the problem of context, remain the greatest unsolved problems in this field.
Both Joel and I are Americans, and we focused on analysis and our database building on American politics. But I am hopeful that these same methods will be fruitful for analyzing democratic politics in many different countries.
Joel here: he can speak for me, too.
Believe me, I am very aware of Bernie Sanders’ electoral strength as measured before 2018.
Freedom Caucus membership is not officially published, so we relied on public reporting and candidate self-designation for membership.
This is the same method Joe Weisenthal used in creating FedLock to determine whether a given Fed speech or statement was hawkish or dovish.
For this, we used Jev, the new System One model from Typesafe, Jev is like an LLM in that it converts natural language (tokens) as an input into a categorization scheme, but different in that rather than creating language as an output, it creates categories and probabilities for sorting. So it is not properly a “language model” but a “classification model”.
Both of these are real. The Trump one comes from an ad run by Paul Gosar in his 2024 House race in Arizona, and the arms-bearing one comes from the website of Steve Russell from his 2018 House race in Oklahoma.
Ken Calvert, a Republican running for House in California in 2024. See Appendix for a whole table of these.
Hi, Michael here. Yes, I spent hours and hours hand-coding “gold sets” of issue positioning in order to determine that a certain ad contained a pro-gun control or pro-tax cut message. I have a lot of plans for what to do with this data, and I think there’s a lot it can add to this model. But for the purposes of publishing clear and straightforward findings by Election Day, there’s no question that a simple list of issue positions by heterodoxy and orthodoxy performed significantly worse.